April 21, 2013

Has The Laptev Sea Ice Started Melting?

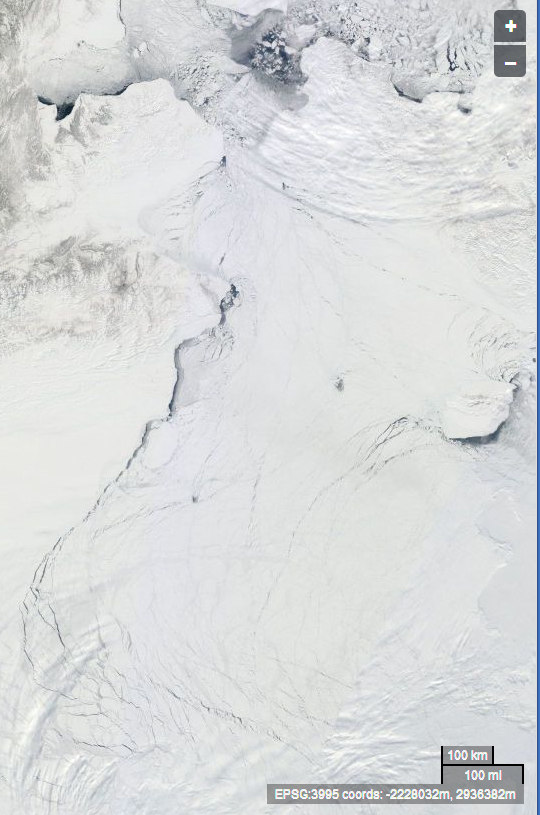
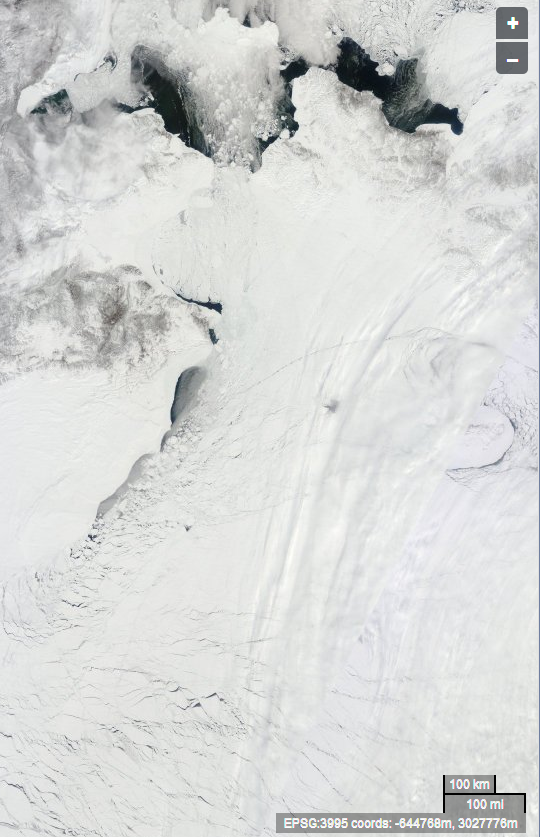
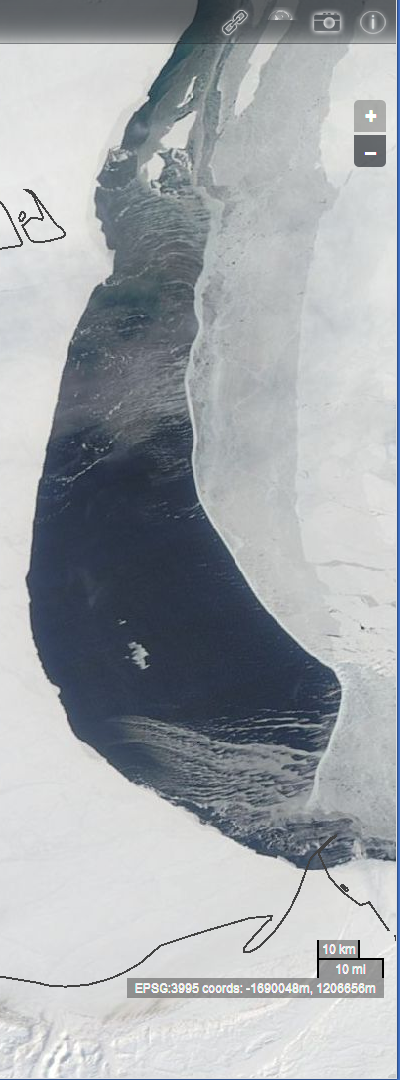
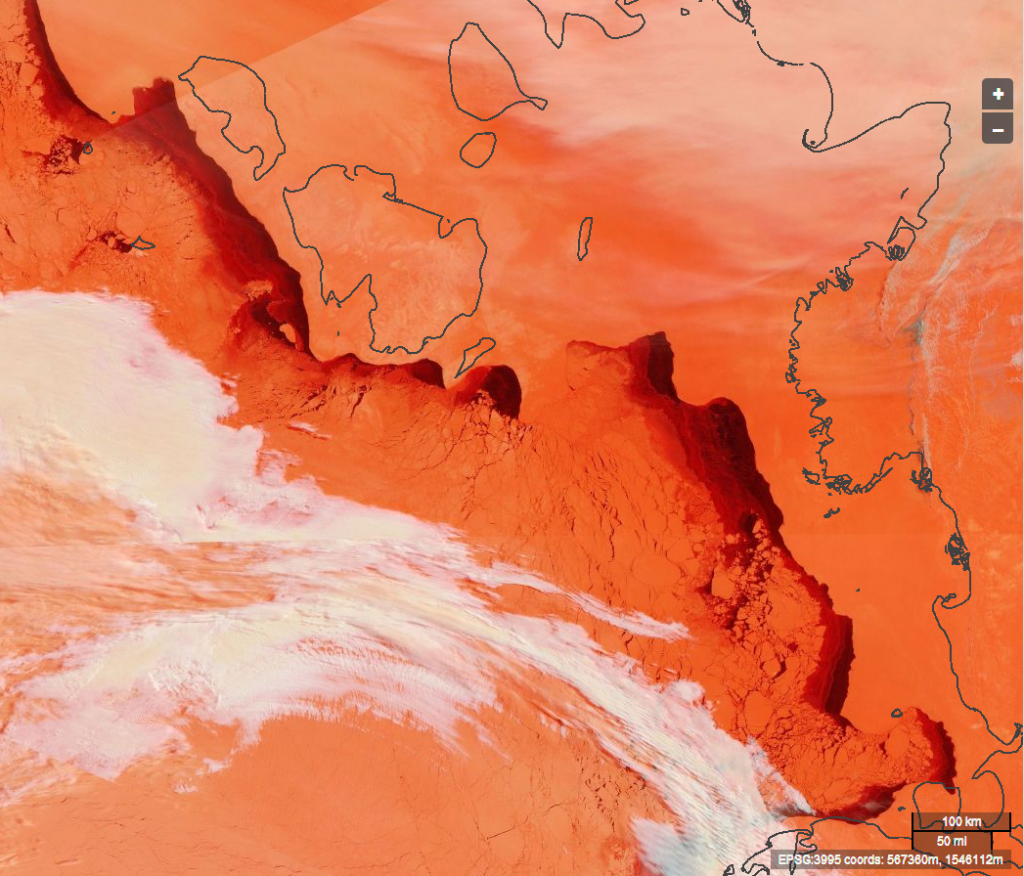
The set of cracks in the Arctic sea ice across the Beaufort and Chukchi Seas that we showed three days ago have now refrozen, and some new ones have opened up nearer the north coast of Alaska. However whilst that has been going on another set of "cracks" over on the Russian side of the Arctic have been growing ever wider. Here's how the Laptev Sea looks from space this morning:

Satellite view of the Laptev Sea on April 21st 2013, courtesy of NASA Worldview

Satellite view of the Laptev Sea on April 21st 2013, courtesy of NASA Worldview

You will note that this image looks a lot redder than the ones we showed you of the Beaufort Sea. That's because this one uses the Terra / MODIS bands 3-6-7 base layer instead of the true colour base layer used in those previous images. According to NASA's MODIS layer information:

The 3-6-7 composite assigns Bands 3, 6, and 7 to the red, green, and blue components of a digital image. This combination is good for revealing snow and ice because they are very reflective in the visible part of the spectrum, and very absorbent in Bands 6 and 7, which are a part of the spectrum called the short-wave infrared, or SWIR.

Since the only visible light used in these images (Band 3) is assigned to red, snow and ice appear bright red. The more ice, the stronger the absorption in the SWIR bands, and the more red the color. Thick ice and snow appear vivid red (or red-orange), while small ice crystals in high-level clouds will appear reddish-orange or peach.

Liquid water on the ground will be very dark since it absorbs in the red and the SWIR, but small liquid water drops in clouds scatter light equally in both the visible and the SWIR, and will therefore appear white. Sediments in water appear dark red.

It certainly looks as though there are some large expanses of open water in the area at the moment, and this is not a wholly unprecedented occurrence. In a recent academic paper entitled "Variability and trends in Laptev Sea ice outflow between 1992–2011"  Krumpen et. al. point out that:

The pack ice drift is dominated by persistent offshore winds leading to a continuous export of  ice out of the Laptev Sea. Between pack ice and fast ice edge, flaw polynyas are formed: the New Siberian polynya, the Western New Siberian polynya, the Anabar-Lena polynya, the Taymyr polynya and the Northeastern Taymyr polynya.

If you want to work out which one is which there's a diagram in the full paper. For a second opinion on whether there's currently open water in those polynyas let's now take a look at a different image, this time recorded by the Advanced Microwave Scanning Radiometer 2 (AMSR2 for short) aboard the Japanese SHIZUKU satellite:

JAXA AMSR2 false colour image of the Arctic on April 21st 2013

JAXA AMSR2 false colour image of the Arctic on April 21st 2013

If you look slightly left of centre you can see that there is a dark brown border along the edge of the Laptev Sea. It seems that both microwaves and short-wave infrared are agreed that there is open water in that area just at the moment.  JAXA hadn't even launched the SHIZUKU satellite this time last year, but here's an image from a different satellite from exactly one year ago for comparison purposes:

WindSat Arctic sea ice concentration image from April 21st 2012

WindSat Arctic sea ice concentration image from April 21st 2012

Can you spot the difference in the areas of open water?

Filed under Climate by

April 18, 2013

Beaufort Sea Ice Cracks Once More

The ice covering the Beaufort Sea has already found itself split by fractures many hundreds of miles long more than once this year. Now it is cracking at the seams once again, as this picture taken by the Terra satellite yesterday reveals:

Satellite view of the Beaufort Sea on April 17th 2013, courtesy of NASA Worldview

Satellite view of the Beaufort Sea on April 17th 2013, courtesy of NASA Worldview

You can still make out the tracery of refrozen cracks from the previous fracturing events "underneath" the latest set. The question now is whether these new fissures will freeze over too, or whether this heralds the early onset of the "real" melting season in the area.

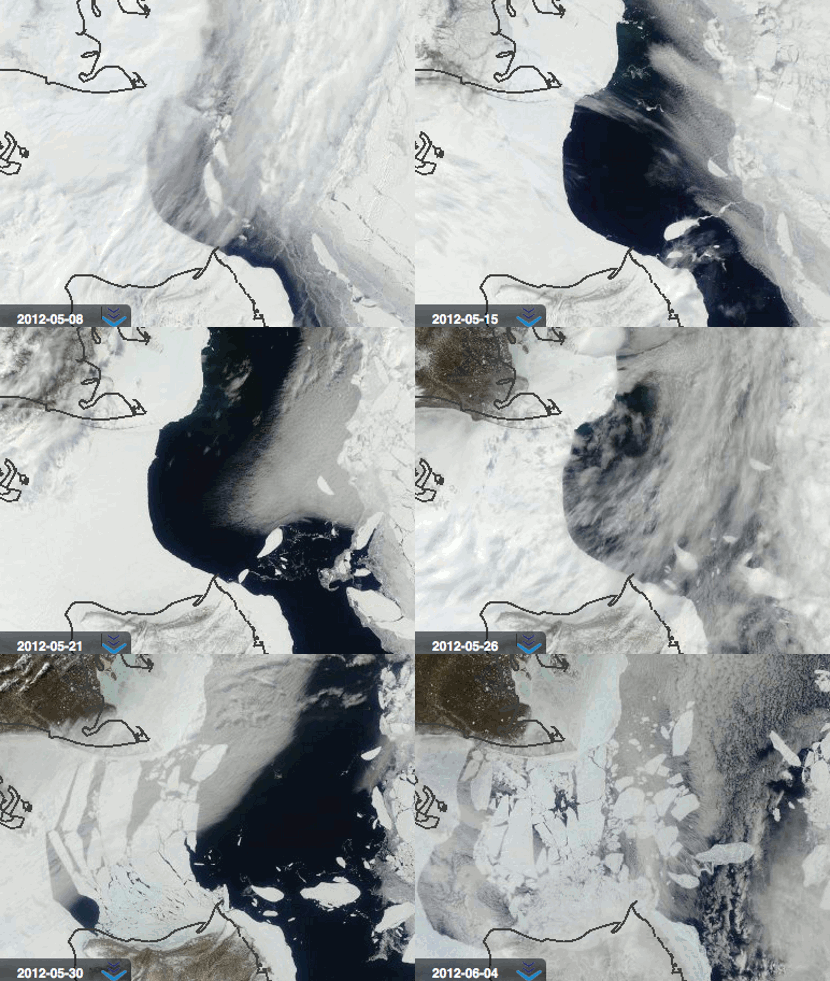
For comparison purposes, this is how the same area looked on May 8th last year, which is as far back as the images available through NASA's EOSDIS Worldview web site go:

Satellite view of the Beaufort Sea on May 8th 2012, courtesy of NASA Worldview

Satellite view of the Beaufort Sea on May 8th 2012, courtesy of NASA Worldview

This animation created from Worldview images by "A-Team" for the Arctic Sea Ice blog reveals what happened next last year:

The Beaufort Sea Ice Melting in late May 2012

The Beaufort Sea Ice Melting in May 2012

Something similar will happen again this year. The 64 trillion dollar question is "When?"

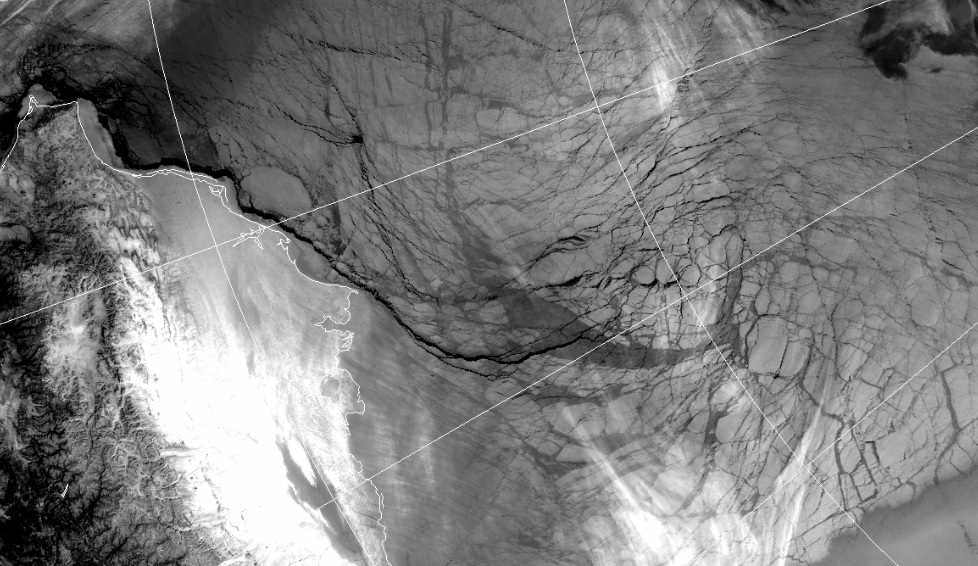
[Addendum] A-Team points out that "For cracks, infrared is far better than MODIS visible", so here's a slightly cloudy AVHRR image courtesy of Environment Canada. It shows a smaller area of the Beaufort Sea on the same day, albeit with the image rotated compared to the visible light ones above. The different shades of grey represent different temperatures. It allows you to better visualise the new cracks superimposed on the older ones, and also allows easier comparison with the February images linked to above:

The ice in the Beaufort Sea coming apart at the seams, at 5:18 GMT on April 17th 2013

The ice in the Beaufort Sea coming apart at the seams again, at 5:18 GMT on April 17th 2013

Filed under Climate by

April 11, 2013

NASA Chasing Calving Ice in Western Greenland

NASA have recently been flying low over the sea ice in the Arctic on their latest IceBridge mission, measuring its thickness and recording a variety of images too, amongst other things.  In our All Fools' Day quiz here on econnexus.org.uk we took a close look at the sea ice around the Disko Bay area of Western Greenland. One reason for doing that was because, as Julia Slingo who is chief scientist at the UK's Met Office pointed out only yesterday:

The Arctic is intimately linked with the North Atlantic and we know there are links, for example, in the ocean temperatures that run down the west coast of Greenland. They are very warm at the moment. Exceptionally warm!

Another reason is that below centre of those satellite images of Disko lies a glacier that goes by a variety of different names in a variety of different languages.  Whether you prefer to call it Sermeq Kujalleq, Jakobshavn Isbræ or even Jakobshavn Glacier this month both we and NASA have been zooming in and taking a much closer look at the Ilulissat Icefjord and the glacier that lies at its head. According to Wikipedia Sermeq Kujalleq:

Drains 6.5% of the Greenland ice sheet and produces around 10% of all Greenland icebergs. Some 35 billion tonnes of icebergs calve off and pass out of the fjord every year. Icebergs breaking from the glacier are often so large (up to a kilometer in height) that they are too tall to float down the fjord and lie stuck on the bottom of its shallower areas, sometimes for years, until they are broken up by the force of the glacier and icebergs further up the fjord. Studied for over 250 years, Jakobshavn Glacier has helped develop our understanding of climate change and icecap glaciology.

Already this year a lot more icebergs have broken from the glacier. I first found out about the most recent of these events over on the Arctic Sea Ice Forum, where it was reported by "Yuha" on April 7th that:

The calving front is visibly retreating as seen by comparing Terra images from days 94 and 96

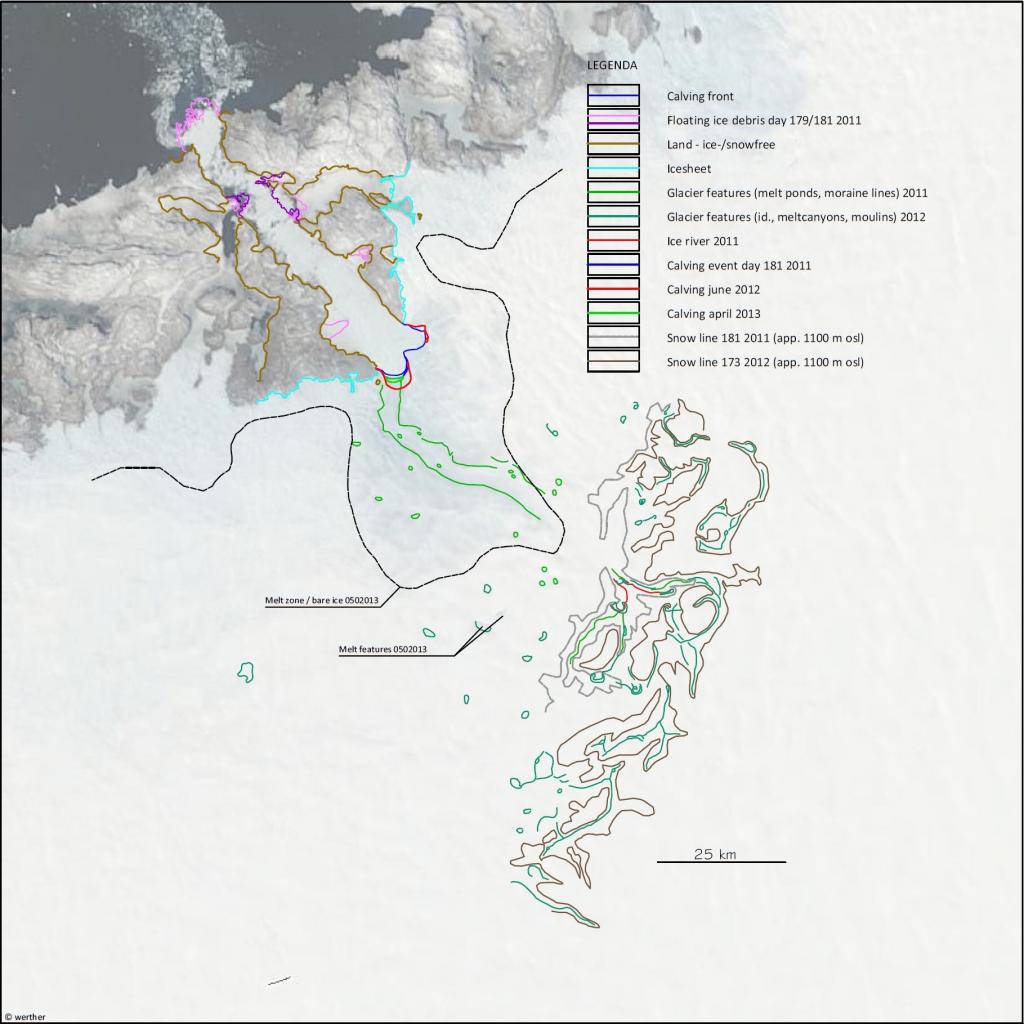
After that "Werther" swiftly produced this CAD image revealing the precise dimensions of a variety of such calving events over recent years, along with some intriguing insights into the earliest days of the 2013 Greenland ice sheet melting season:

Sermeq Kujalleq calving events and melting zones

Sermeq Kujalleq calving events and melting zones

According to Werther:

I marked a ‘melt zone/bare ice’-line and two remarkable features high up (900 m +SL). One of them is a regular melt lake that usually shows up in May. The melt zone-line nicely shows the thinning basin surrounding the glacier. There’s enough going on to fear another ravaging summer for the GIS….

As luck would have it NASA have also been monitoring the very same calving event using their P3-B "airborne laboratory". Here's their explanation of why they've been doing that:

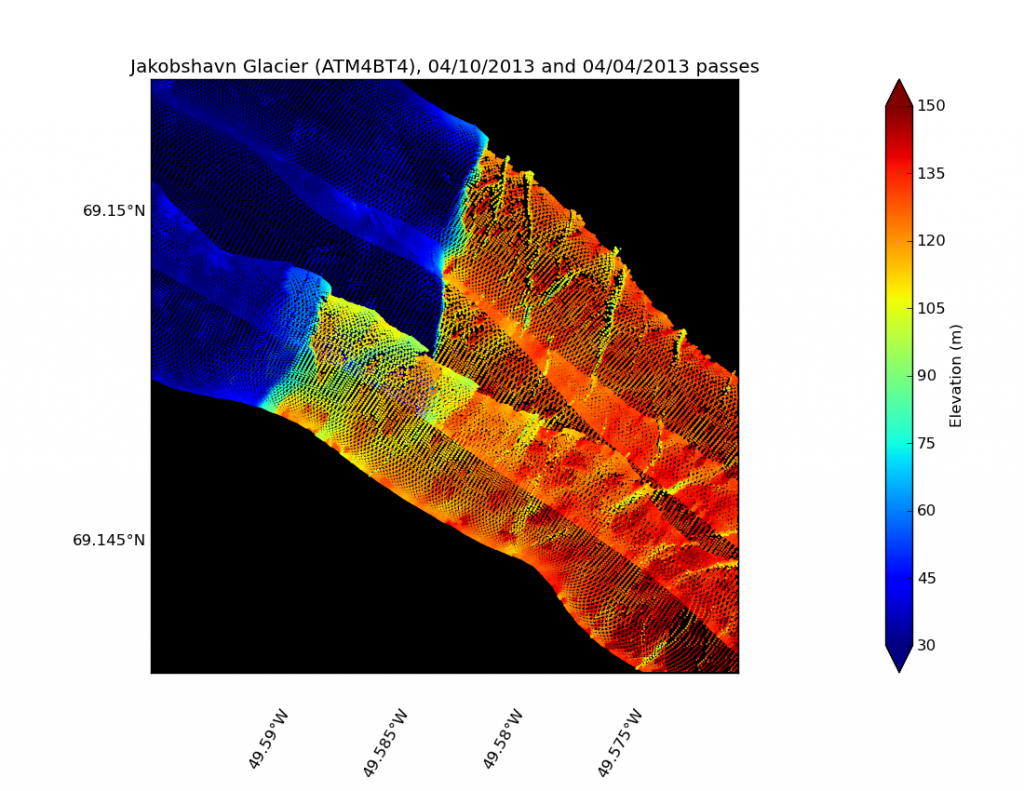
and here's a preliminary LIDAR image from that mission, revealing that the calving front of the Jakobshavn Glacier retreated by about 200 metres between April 4th and April 10th 2013:

LIDAR image courtesy of NASA IceBridge 2013

LIDAR image courtesy of NASA IceBridge 2013

To give you a feel for what NASA's P3-B pilot saw on those Jakobshavn Glacier missions, here's the view from the cockpit recorded on April 9th. This video is of a different glacier though, this time in South East Grrenland.

Finally, for the moment at least, here is what a somewhat larger calving event at the head of the Ilulissat Icefjord in 2008 looked and sounded like:

Filed under Climate by

April 10, 2013

Met Office Admit "Our Climate Is Being Disrupted by the Warming of the Arctic"

According to ITV News this evening:

The Met Office is calling a meeting of top scientists to look at the "urgent" question of whether the warming of the Arctic is affecting UK weather.

In an interview with ITV Professor Julia Slingo OBE, chief scientist at the United Kingdom's Met Office has been commenting on the evident changes in the Great British Climate over the last few years. Julia told ITV (amongst other things) that:

It's not proven yet, we've a lot more research to do, but if you look at the way in which weather patterns have behaved over say the last four or five years, we're beginning to think that there is something happening, that in a sense our climate is being disrupted by the warming of the Arctic that we've observed very dramatically since 2007.

The early evidence from the work we've done suggests that in winter and spring the warmth of the Arctic is tending to set up cold, easterly, dry winters. The sorts of things we've seen certainly this year, and of course in 2010. In summer the case is not proven at all.

When asked:

What do you feel in your bones, so to speak.

Julia replied that:

It's hard to believe that the changes that are going on in the Arctic so dramatically since 2007 aren't going to affect our weather patterns. My gut feeling is that it's very likely that what's happening in the Arctic will affect our climate.

We need to get to grips with it, and quickly, because if this is how climate change could manifest itself then we need to understand that as a matter of urgency, which is why I believe we should pull together the best scientists to really see how do we detect an influence of the Arctic on the jet stream and on our weather patterns around the world. It's a really urgent question.

ITV News also interviewed Professor Jennifer Francis of the Institute of Coastal and Marine Science at Rutgers University. Jennifer told ITV (amongst other things) that:

This change in the Arctic is something that the system hasn't seen, certainly in recent history. I have to believe that it's very likely that the changes in the Arctic are affecting the large scale circulation patterns in the Northern Hemisphere.

You can watch a recording of those conversations via the link to the ITV News web site at the top of this article, which also includes a report from the Barneo ice camp near the North Pole.

Filed under Climate by

April 6, 2013

Spring Has Sprung. What Else Is News?

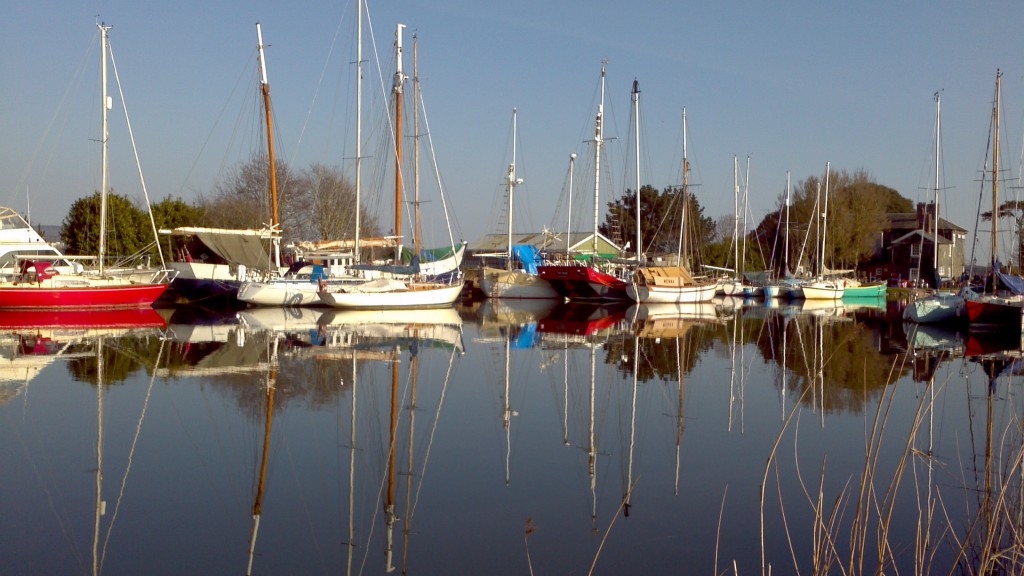
It was a nice sunny day today in South Devon, for the first time in a very long time. Here's some proof:

Blue skies and still waters at The Turf Locks on April 6th 2013

Blue skies and still waters at The Turf Locks on April 6th 2013

Over one month early the Daily Mail announced on March 1st 2013 that:

Spring has sprung: Milder weather, blossoming flowers and the season's first lamb herald an end to wintry conditions.

In common with some of their more recent pronouncements on the great British climate, the Mail got that one wrong. In fact, according to the Met Office rather than The Mail:

Provisional full-month Met Office figures for March confirm it has been an exceptionally cold month, with a UK mean temperature of 2.2 °C.

This is 3.3 °C below the 1981-2010 long-term average for the month, and ranks this March as joint second coldest (with 1947) in our records dating back to 1910. Only March 1962 was colder, with a record-breaking month mean temperature of 1.9 °C.

In an unusual turn of events, this March was also colder than the preceding winter months of December (3.8 °C), January (3.3 °C) and February (2.8 °C). This last happened in 1975.

Not only was March 2013 cold, it was also rather damp at times, down here in Devon at least. According to the table in another Met Office blog post from a few days earlier this is what was happening weather wise in Devon in March:

Mean temperature Precipitation
Region Actual
(deg C)
Difference from
1981-2010 average
(deg C)
Actual
(mm)
Percentage of
1981-2010 average
(%)
Devon 4.0 -2.7 112.9 118

which made us the wettest county in England over the month. Added to all the previous precipitation in these parts over the previous 12 months, here's some related recent news. The BBC reported two days ago that a Landslip at Oddicombe beach turns sea red:

A landslip at a beach in south Devon has turned the sea in the area red and caused an already partially collapsed empty house to be further damaged. Thousands of tonnes of earth and stone were estimated to have fallen at Oddicombe beach on Tuesday night, Torbay Council said. A section of the beach has been closed as a result.

A bit further down the coast Torbay Council were busy trying to solve another problem. According to the BBC once again Torquay sewer-collapse threat forces raw waste into sea:

Raw sewage is having to be pumped into the sea at a Devon holiday resort in a bid to stop a main sewer collapsing. A breach in the sea wall at Livermead in Torquay caused part of the road to collapse, undermining the sewer. South West Water (SWW) has had to divert flows away from the sewer as a result, forcing it to pump the raw waste into the sea at Hope's Nose.

Campaign group Surfers Against Sewage (SAS) said pumping raw sewage into the sea was "a return to the bad old days". People have been been warned not to swim at Beacon Cove, Torre Abbey and Hollacombe and warning signs have been put up. South West Water said there was also an increased risk of pollution at Shoalstone, Broadsands, Goodrington, Paignton Sands, Preston Sands, Meadfoot, Anstey's, Babbacombe, Oddicombe, Watcombe and Maidencombe.

Heading a bit further afield in Devon now, New Scientist reports this weekend that:

Atmospheric rivers are vast, unbroken streams of water-laden air that can snake thousands of kilometres through the sky. Only recently identified and named, they are huge not just in geographical extent. "In terms of the water they dump as precipitation, atmospheric rivers are every bit as big and bad as hurricanes," says Michael Dettinger of the United States Geological Survey in La Jolla, California.

In the five days leading up to Christmas, the seaside city of Plymouth got more rain than it usually gets in the whole of December. In Braunton, 80 kilometres to the north, the river Caen overwhelmed a recently completed flood-control project, inundating the town with water instead of shoppers. The main rail link connecting the region to the rest of the UK was cut off for six days.

Expanding our focus to include the weird weather across the nation over the last year, the National Farmer's Union is worried that "we're running out of wheat". According to The Independent:

Britain will be forced to become a net importer of wheat for the first time in a decade this year, after the recent bitter weather devastated crops. A disastrous 12-month cycle of poor weather has ruined harvests across the UK, costing farmers an estimated £500m, the chief economist of the National Farmers Union (NFU) warned. The conditions mean Britain – traditionally a significant net exporter of wheat – will have to boost imports by more than a million tonnes.

Nor is wheat the only crop crop affected. Potato plantings stood at just 4,000 hectares at the end of March, barely a 10th of the 30,000 hectare area that had been planted this time last year, implying a jump in potato imports next crop year.

Expanding our focus even further to include the northernmost parts of the Northern Hemisphere, the US National Snow and Ice Data Center reports that:

Spring has sprung in the Arctic. Arctic sea ice has passed its annual maximum extent and is beginning its seasonal decline through the spring and summer. The circulation pattern known as the Arctic Oscillation (AO) reached an extreme negative phase in the second half of the month, associated with unusually high sea level pressure covering nearly the entire Arctic Ocean.

The month was also notable for continued fracturing of the ice cover in the Beaufort and Chukchi seas north of Alaska. This is consistent with wind patterns associated with the strong negative pattern of the AO.

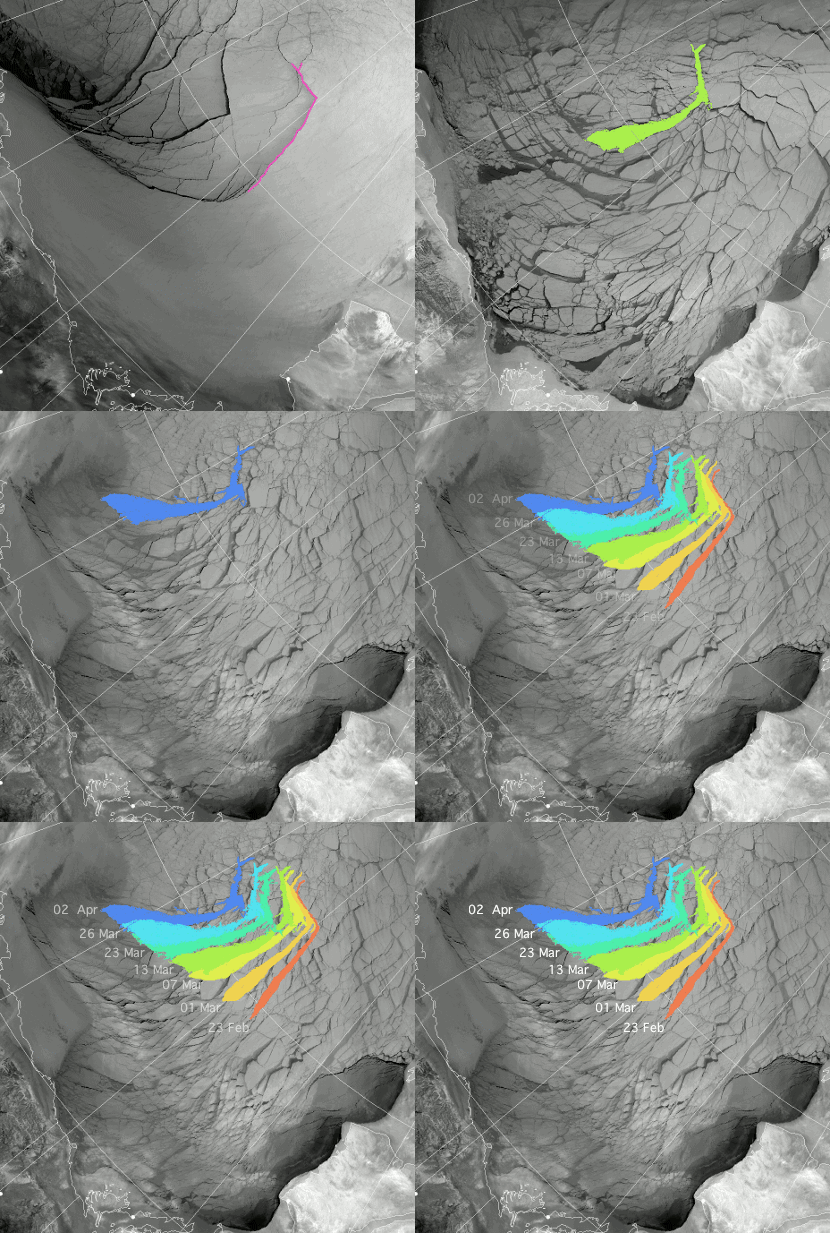
Here's an animation from "A-Team" on the Arctic Sea Ice blog, which reveals that fracturing taking place:

Arctic Sea Ice "On The Move" across the Beaufort Sea in February and March 2013

Arctic Sea Ice "On The Move" over the Beaufort Sea in February and March 2013

NASA had a slightly different take on the extreme negative phase of the Arctic Oscillation during March. They show this picture of anomalous temperatures across the globe:

Global land surface temperature anomalies between March 14–20, 2013, courtesy of NASA

Global land surface temperature anomalies between March 14–20, 2013, courtesy of NASA

and report that:

While a high-pressure weather system brought warmer than normal temperatures to Greenland and northern Canada in March 2013, much of North America, Europe, and Asia shivered through weeks of unseasonably cool temperatures. The contrasting temperatures are no coincidence: the same unusual pressure pattern in the upper atmosphere caused both events.

Has it ever occurred to you that perhaps it would be prudent for the powers that be to start considering what happened to the Arctic sea ice?

Filed under Climate by

April 1, 2013

Is The Economist Being Economical With The Truth About Climate Change?

Today is April 1st, Easter Monday 2013. However this tale is no joke. Before we get on to more serious matters would you care to join me in some festive fun? Let's play "spot the difference"! To get some images free from clouds I've gone back in time a couple of days into March. Having done that here's a bird's eye view of the Disko Bay area of western Greenland, taken on March 28th 2013:
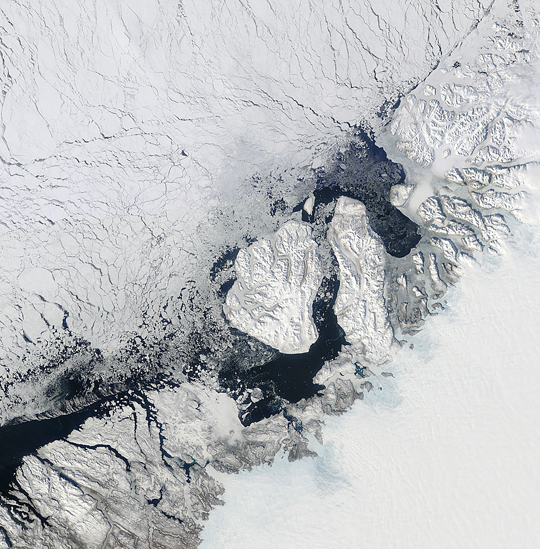
The Disko Bay area of western Greenland on March 28th 2013

The Disko Bay area of western Greenland on March 28th 2013

Now here's one taken a year earlier, on March 28th 2012:
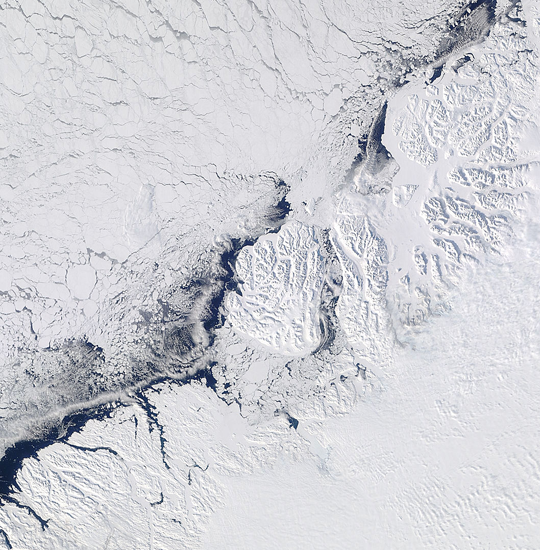
The Disko Bay area of western Greenland on March 28th 2012

The Disko Bay area of western Greenland on March 28th 2012

Do you notice any difference?

Whilst you ponder that question I'll endeavour to explain the relevance of the econnexus Easter quiz to the title of today's post. Fresh from enjoying the experience of having my constructive climate change comments deleted by the "Mail Online" a couple of weekends ago, I now bring you the fruits of my experience over the weekend on the The Economist web site. Just in case you're wondering, The Economist "online" does allow relevant links, and doesn't seem to delete relevant comments.

In their latest print edition The Economist includes a leader entitled "Apocalypse perhaps a little later" which says (amongst other things) that:

It is not clear why climate change has "plateaued" (see pages 81-83)

Frankly it is astonishing news to me to read that "climate change has plateaued" and for reasons I will explain shortly it ought to be astonishing to The Economist's leader writer also. Turning eagerly to page 81 I discovered an article in the "Science and technology" section, which begins as follows:

Climate science
A sensitive matter

The climate may be heating up less in response to greenhouse-gas emissions than was once thought. But that does not mean the problem is going away.

Over the past 15 years air temperatures at the Earth’s surface have been flat while greenhouse-gas emissions have continued to soar.

Perhaps the Economist's leader writer is confusing "climate change" with the Economist's Science and Technology writer's "air temperatures at the Earth’s surface"? At least the leader writer gives the impression that they may recall having read James Astill's Economist Special Report entitled "The melting north" from June 16th 2012, in which he said (amongst other things) that:

The Arctic is warming twice as fast as the rest of the planet.

The area of Arctic land covered by snow in early summer has shrunk by almost a fifth since 1966. But it is the Arctic Ocean that is most changed.

Scientists, scrambling to explain this, found that in 2007 every natural variation, including warm weather, clear skies and warm currents, had lined up to reinforce the seasonal melt. But last year [i.e. 2011] there was no such remarkable coincidence: it was as normal as the Arctic gets these days. And the sea ice still shrank to almost the same extent.

Of course since those words were written the Arctic has experienced the record shattering melting of sea ice during the summer of 2012. Mr. Astill went on to write:

There is no serious doubt about the basic cause of the warming. It is, in the Arctic as everywhere, the result of an increase in heat-trapping atmospheric gases, mainly carbon dioxide released when fossil fuels are burned. Because the atmosphere is shedding less solar heat, it is warming—a physical effect predicted back in 1896 by Svante Arrhenius, a Swedish scientist. But why is the Arctic warming faster than other places?

In partial answer to that question he goes on to explain that:

The main reason for Arctic amplification is the warming effect of replacing light-coloured snow and ice with darker-coloured land or water. Because dark surfaces absorb more heat than light ones, this causes local warming, which melts more snow and ice, revealing more dark land or water, and so on. Known as the albedo effect, this turns out to be a more powerful positive feedback than most researchers had expected. Most climate models predicted that the Arctic Ocean could be ice-free in summer by the end of this century.

Are you beginning to see the connection with our Easter 2013 quiz question yet?  Returning to the present day from early summer 2012, the writer of "Climate science – A sensitive matter" seems to be unaware of any of this, since in their three page article they do mention "feedbacks", but the words "albedo" and "Arctic" are conspicuous only by their total absence. This is all the more surprising, to your humble scribe at least, since less than three weeks ago I attended The Economist's very own "Arctic Summit" in Oslo. The Economist invited a panel of scientists, who one must assume were considered by that august journal to be eminent in their respective fields, to briefly address the assembled throng. First to speak was Stefan Rahmstorf, Professor of Physics of the Oceans at Potsdam University, who gave an overview of his recently published scientific paper "Quasiresonant amplification of planetary waves and recent Northern Hemisphere weather extremes", which concludes (amongst other things) that:

The data and results we present suggest that atmospheric conditions already might have changed to the extent that the considered quasiresonant wave amplification may occur rather frequently. The most recent example might be the destructive heat waves in the United States and southern Europe accompanied by catastrophic floods in China and Japan in June–July 2012.

Stefan himself concluded his remarks in Oslo by saying that:

We know there is enough ice in Greenland to raise global sea level by 7 metres. We also know that the Greenland Ice Sheet has a critical warming threshold beyond which it will decay due to some kind of "vicious circle", so I think we should all care about the Arctic, and about stopping global warming as fast as we can.

With that message possibly still ringing in his ears the very same James Astill eventually concluded the session, which the event agenda described as "Assessing the risks of a melting Arctic", by asking the four panellists to take part in "a little quiz" with "reputations on the line". He asked:

What is your prediction for when we're going to get a largely ice free summer Arctic?

Listen for yourself:

Stefan answered without hesitation "2040". James next asked Rear Admiral Jonathan White of the United States' Navy, who said:

I got asked this same question by an Admiral in the Navy a couple of months ago, but it was "when are we going to see one month of ice free conditions in the Arctic", ice free being defined as 15% or less ice coverage area wise. I said I think it's happening faster than we thought before. My predecessor said around 2030, and I'm saying 2023. About ten years, and that's pretty aggressive.

Having spoken to him a couple of times in Oslo, I can assure you that Rear Admiral White does not come across as the stereotypical loony left tree hugging environmental activist. All of which raises a big question, in my mind at least, which is:

What on Earth were The Economist thinking of when they printed the words "Apocalypse perhaps a little later" above their weekend leader? They surely can't have meant a little later than 2100 or even 2050. Did they actually mean a little later than The Day After Tomorrow?

In conclusion, for the moment at least, please note that according to their contents page, The Economist was:

First published in September 1843 to take part in "a severe contest between intelligence, which presses forward, and an unworthy, timid ignorance obstructing our progress."

Need I say more? Perhaps only to ask what your own answer to my little festive quiz might be, and also your answer to James Astill's slightly earlier one should you be in a particularly festive mood today?
Filed under Climate by

March 27, 2013

Bigger Cracks Than Ever in the Beaufort Sea Ice

You may recall that a couple of weeks ago we showed you some satellite images revealing that the Beaufort Sea north of Alaska had become covered with a vast spider's web of cracks. Then last weekend gaping fissures tens of miles across opened up in the ice cap north of Greenland. Today we take you back to the Beaufort Sea once more, where this is what the latest satellite images reveal:

Satellite view of the Beaufort Sea west of Banks Island on March 26th 2013

Satellite view of the Beaufort Sea west of Banks Island on March 26th

We characterised the "cracks" north of Greenland as "roughly the distance between Exeter and Newton Abbot across". This one's more like the distance between Exeter and Plymouth across, and it wasn't there a few days ago. These sort of scenes aren't unprecedented in the Arctic, but as the animation in our first post on the "Arctic ice mirror crack'd" shows, last year they weren't to be seen until May.

Meanwhile NASA haven't just being relying on satellites to get a good view of exactly what's going on in the Beaufort Sea. Over the last few days they've been flying low over what's left of the sea ice in their P3-B airborne laboratory on another one of their IceBridge missions. Here's a video showing their preparations for this year's Arctic operation:

Here's a few still images taken out of the window of NASA's P3, giving you a closeup view of the Beaufort Sea ice cracking at the seams yet again, and well over a month earlier than last year:

Image courtesy of NASA IceBridge 2013

Image courtesy of NASA IceBridge 2013

Image courtesy of NASA IceBridge 2013

Image courtesy of NASA IceBridge 2013

Image courtesy of NASA IceBridge 2013

Image courtesy of NASA IceBridge 2013

For even more pictures from NASA's P3-B see also the blog of IceBridge 2013 team member Christy Hansen, and NASA's own Operation IceBridge blog.

Filed under Climate by

March 21, 2013

A New World View From NASA

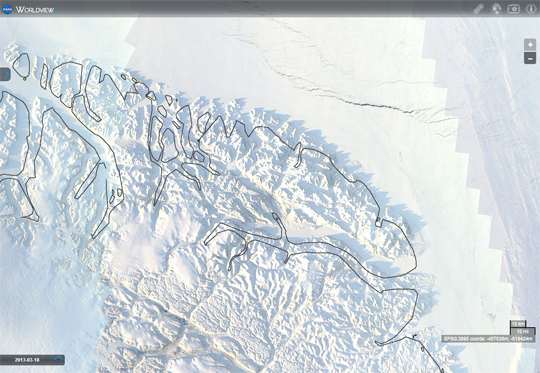
I've just stumbled across an exciting new (to me at least) section of the NASA web site. It's called Worldview, and it does what it says on the tin. It's part of NASA's Earth Observing System Data and Information System (EOSDIS for short), and it gives you a satellite's view of planet Earth a bit like Google Earth, except that it's updated on a daily basis! To give you some idea of the power of Worldview, and also an insight into why I was wandering the virtual corridors of NASA late last night, here's a "close up" image of Cape Morris Jesup, the most northerly point in Greenland, taken on March 18th 2013:

Cracks appearing in the sea ice north of Cape Morris Jesup on March 18th 20

Cracks appearing in the sea ice north of Cape Morris Jesup on March 18th 2013

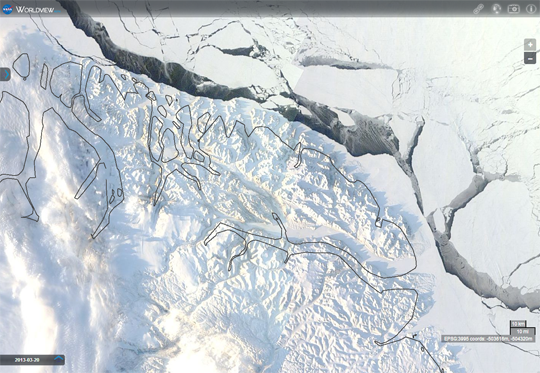
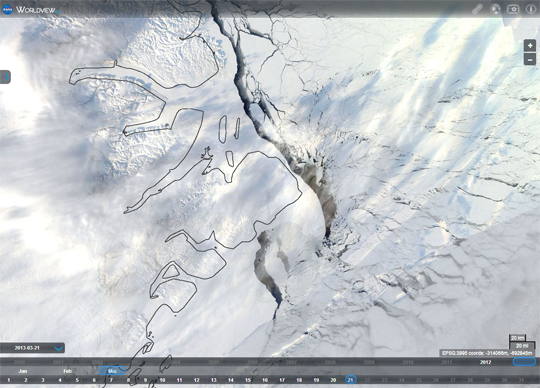
Two days later here is NASA Worldview's take on recent events in that one small part the Arctic:

Cracks in the sea ice north of Cape Morris Jesup have grown by March 20th 2013

Cracks in the sea ice north of Cape Morris Jesup have grown by March 20th 2013

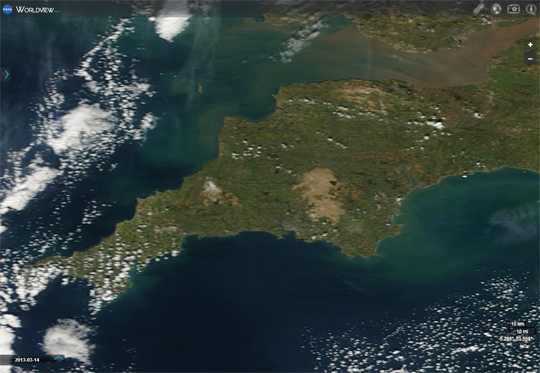
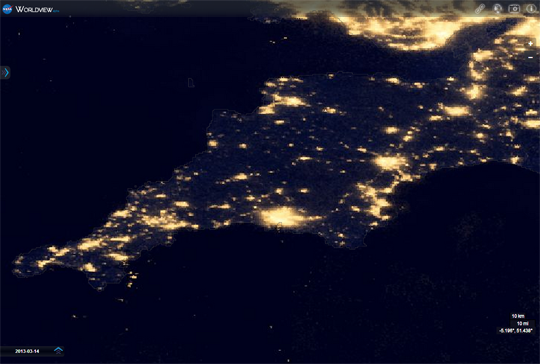
As you can see, the United States Navy's predictions a couple of days ago about what would happen to the Arctic sea ice in the near future are starting to come true. There is a distance scale visible in the bottom right hand corner of those images, but to give my fellow Devonians a better feel for the scale of these momentous events thousands of miles away, here is NASA's view of our home county, taken from on high and to the same scale the last time it stopped raining here:

NASA's Worldview of South West England on March 14th 2013

NASA's Worldview of South West England on March 14th 2013

Careful comparison between the two images above will reveal that the biggest "crack" in the Arctic sea ice just at the moment is roughly the distance between Exeter and Newton Abbot across, and it literally opened up "overnight".

Worldview has many other tricks up its sleeve. Here's another one – A view of the West Country at night:

The lights of Bristol, Exeter and Plymouth, burning bright in the forests of the night

The lights of Bristol, Exeter and Plymouth, burning bright in the forests of the night

Do you think it would be a good idea if somebody turned out some of those lights?

[Addendum]

It's now the evening of Thursday 21st March in not so sunny South West England. Here's what's happened in the Arctic over the last day or so:

"Cracks" now appearing down the east coast of Greenland, on March 21st 2013

"Cracks" now appearing down the east coast of Greenland, on March 21st 2013

As you can see, the "cracks" have now spread past Nordøstrundingen out into the Fram strait, and also down the east coast of Greenland towards the area often occupied by the North East Water polynya. Note that I've had to zoom out to fit everything in. The little scale in the bottom right now reads "20 miles" instead of the "10 miles" in the earlier images.

In a related local event, the path outside my front door has turned into a stream once again, and the Environment Agency has just issued it's first red flood warning for a while. This one is for the River Cober at Helston in Cornwall. I expect there'll be some in Devon too, before the night is out. There are currently 37 amber flood alerts across South West England:

River levels are very high following persistent heavy rainfall today. Further rainfall is expected throughout the night. Flooding is imminent.

[Addendum Friday March 22nd]

Here's a video showing the floods in Newlyn overnight, and the rain induced landslide which cost one Looe resident her life:

In other related events here in Devon, the BBC report that:

Jubilee Bridge, in Modbury, was destroyed when up to 50mm (2 ins) of rain fell in 24 hours.

Ashburton Primary School near Newton Abbot was closed after part of a road outside it collapsed.

Landslips were reported on the A383 near Bickington, Willow Park Lane in Kingskerswell, and the A379 near Shaldon, where there was also a fallen tree.

The River Otter burst its banks at Otterton. Sidmouth was also affected by flooding.

Filed under Science by

March 18, 2013

The Ice Cap Crack'd From Side To Side

Unfortunately my headline this evening is not from a fictional murder mystery written by Agatha Christie. It is from a science documentary. Let me lead you through it, chapter by chapter. If you're sitting comfortably then let us begin, back on February 10th.

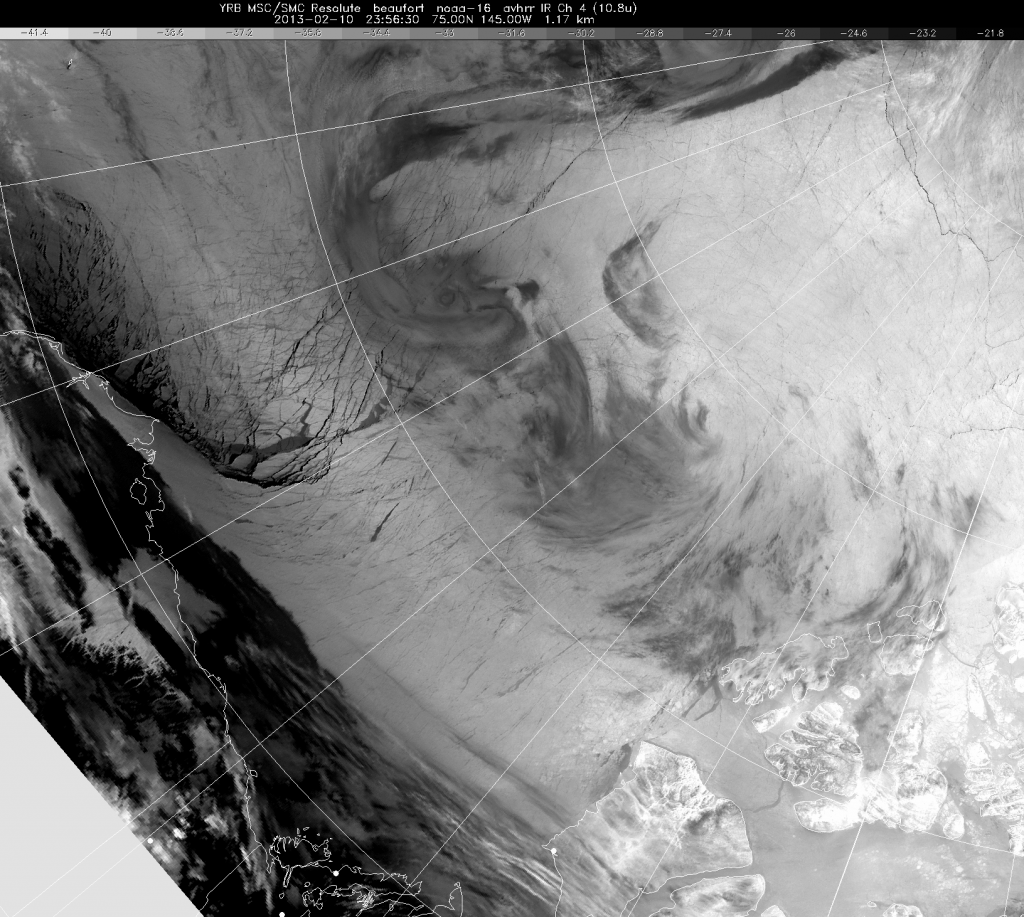
Satellite view of the Beaufort Sea on February 10th 2013

Satellite view of the Beaufort Sea on February 10th 2013

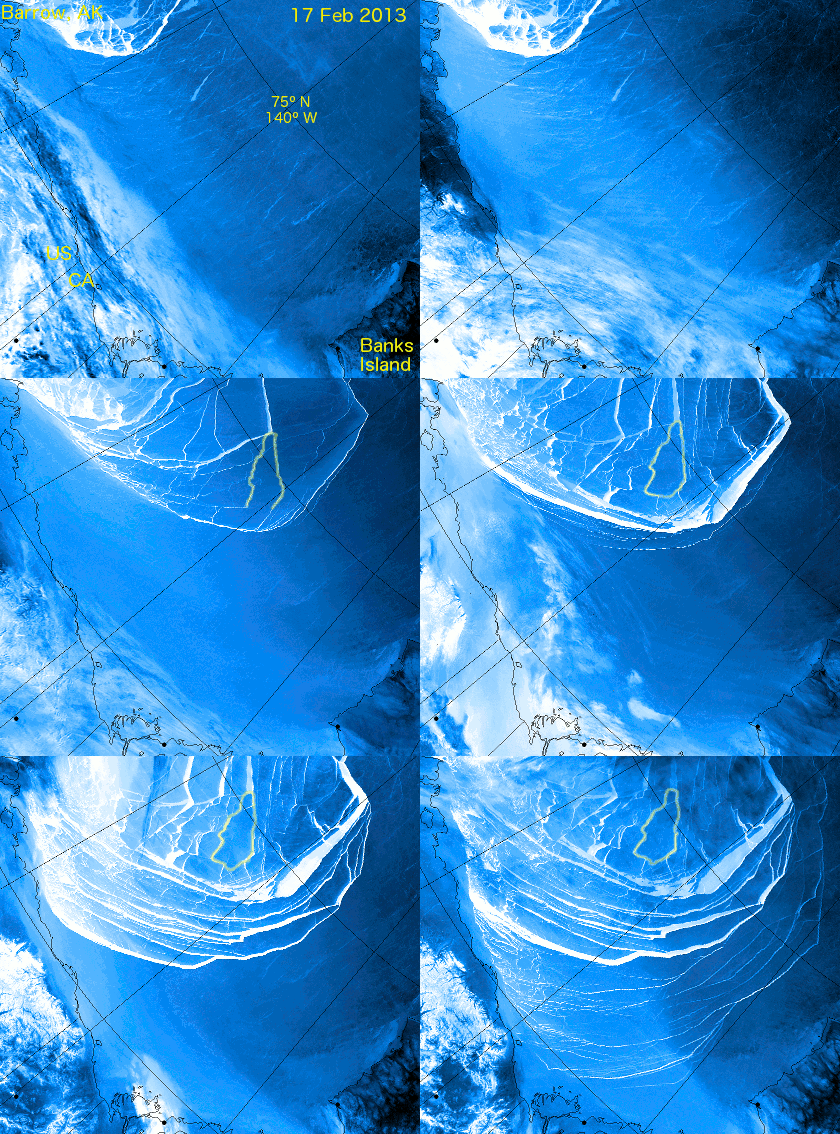
In this image (courtesy of Environment Canada)  you can see significant cracks have already formed in the sea  ice covering the Beaufort Sea north of Alaska, on the left of the satellite image. Now take a look at what happened next with the aid of the following animation (courtesy of "A-Team" on the Arctic Sea Ice Blog) :

Beaufort Sea Ice Cracking Under The Strain

Beaufort Sea Ice Cracking Under The Strain

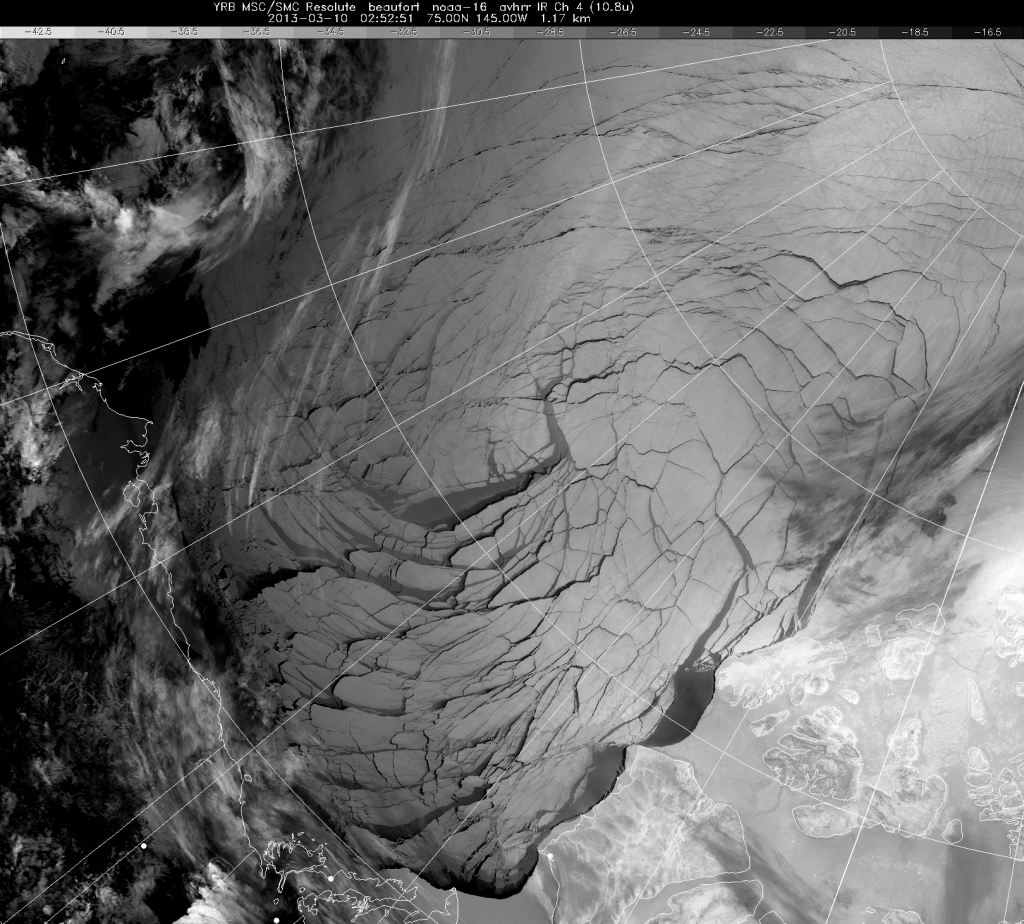
By March 10th the entire area up to the Canadian Arctic Archipelago was covered in a giant spider's web of fractures (again courtesy of Environment Canada) :

Satellite view of the Beaufort Sea on March 10th 2013

Satellite view of the Beaufort Sea on March 10th 2013

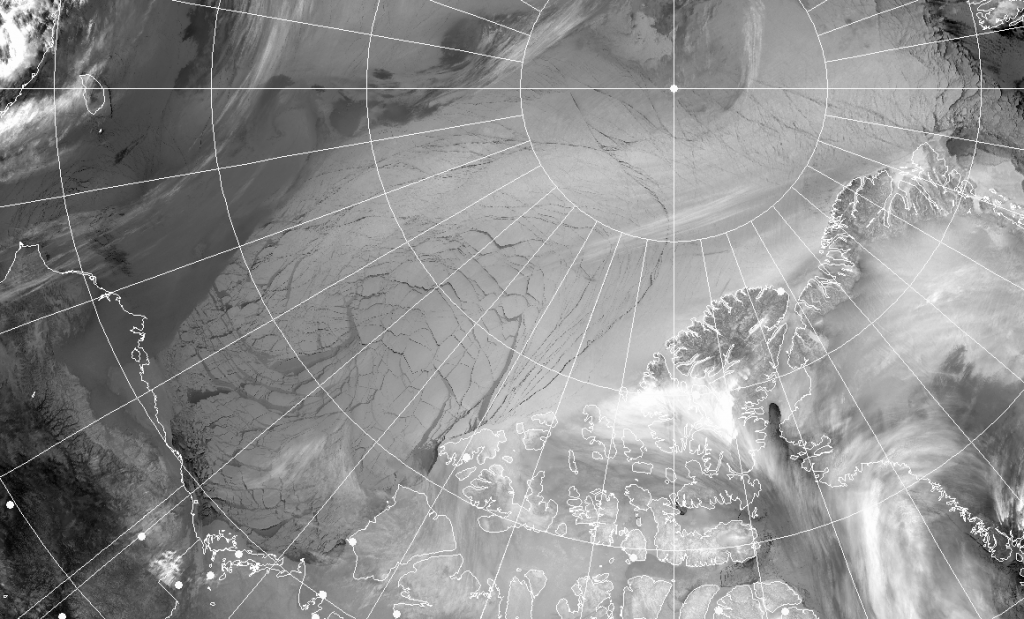
Over the next two days more cracks opened up, this time extending into the area of multi-year ice between Ellesmere Island and the North Pole:

Fractured Arctic sea ice from Barrow to Ellesmere at 23:06 GMT on March 11th 2013 - Click for a larger version

Fractured Arctic sea ice from Barrow to Ellesmere at 23:06 GMT on March 11th 2013

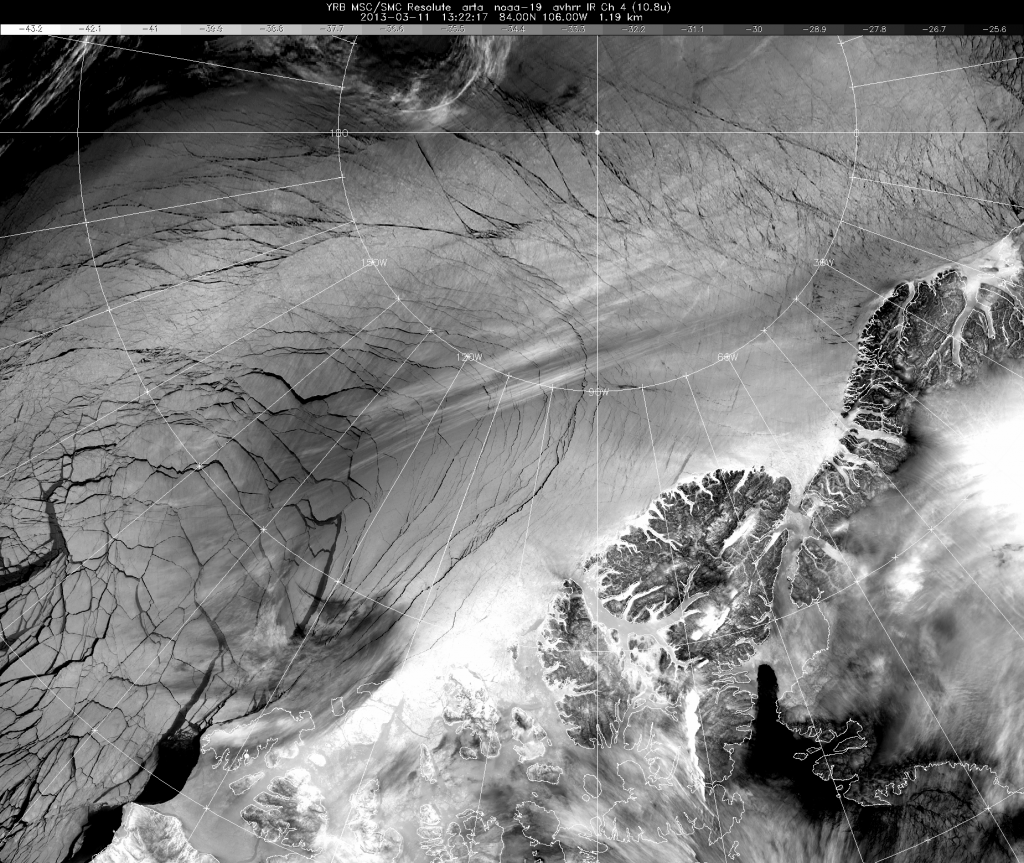
Please note the enormous scale of the system of fractures. The image above reaches from Western Alaska on the left across to North-East Greenland and Svalbard in the top right, and includes the North Pole itself right of centre at the top. Leaving the Beaufort Sea behind for the moment, here's a close up view of those fractures north of Ellesmere Island, once again courtesy of Environment Canada:

Multi-year Arctic sea ice cracking at the seams north of Ellesmere Island at 13:21 GMT on March 11th 2013

Multi-year ice cracking at the seams north of Ellesmere Island at 13:21 GMT on March 11th 2013

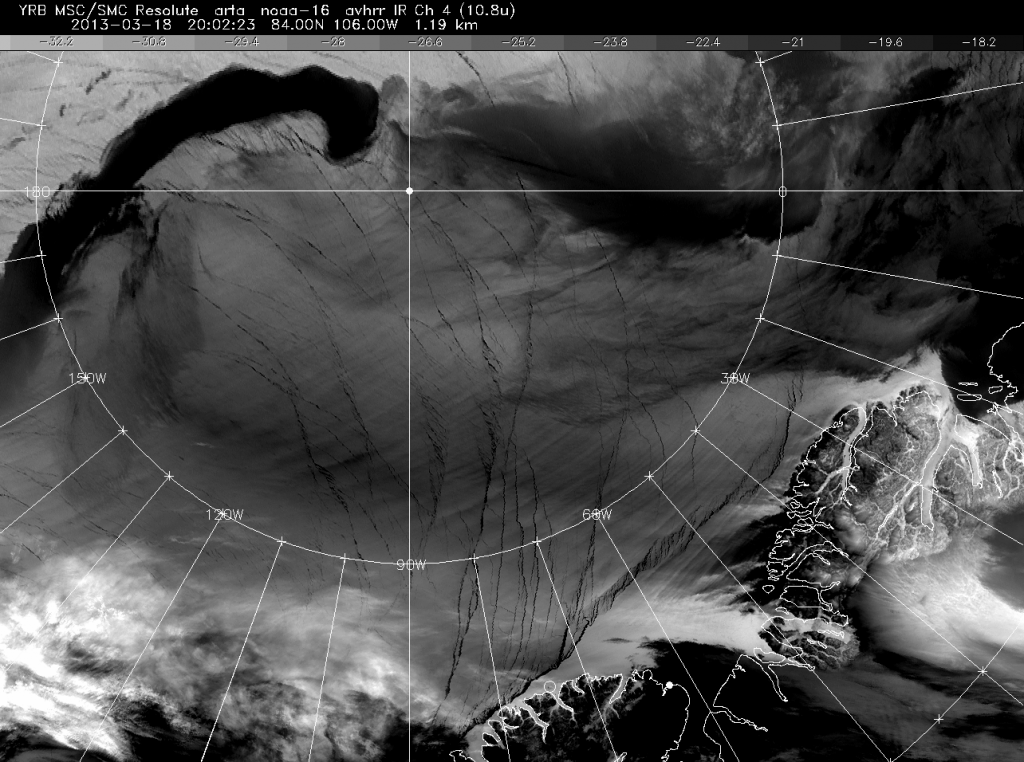
Since then another week has passed, and here is the satellite's eye view of the area of Arctic sea ice between Ellesmere Island and the North Pole this evening:

Multi-year sea ice crack'd from side to side north of Ellesmere Island at 20:01 GMT on March 18th 2013

Multi-year sea ice crack'd from side to side north of Ellesmere Island at 20:01

There are a lot of clouds around at the moment, but you can nonetheless see the latest set of new cracks hugging the north coast of Ellesmere Island and extending further East towards Cape Morris Jesup at the tip of northern Greenland. At the top of the picture, past the clouds, you can also make out yet more cracks arcing past the North Pole over onto the Russian side of the Arctic.

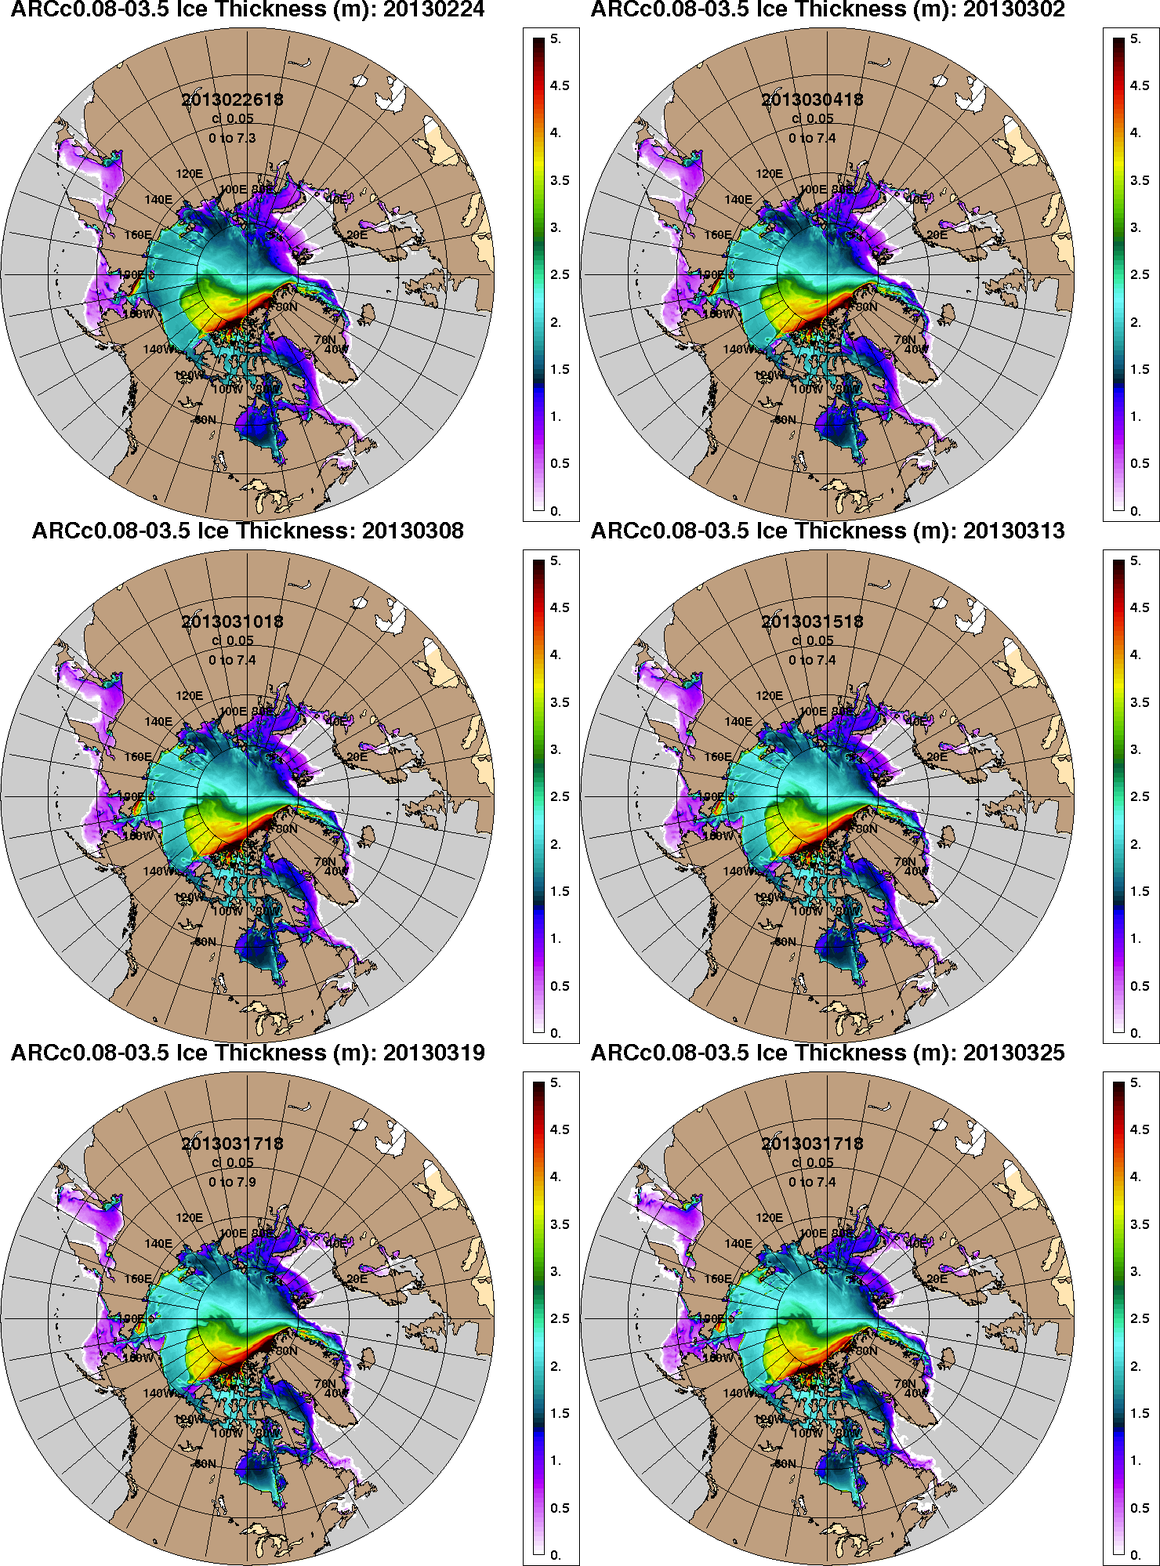
It's been said many a time that nobody knows what the future holds, but here's the US Navy's record of Arctic sea ice thickness for the last three weeks, along with their prediction for the week yet to come:

US Navy Arctic sea ice thickness forecast on March 17th 2013

US Navy Arctic sea ice thickness forecast on March 17th 2013

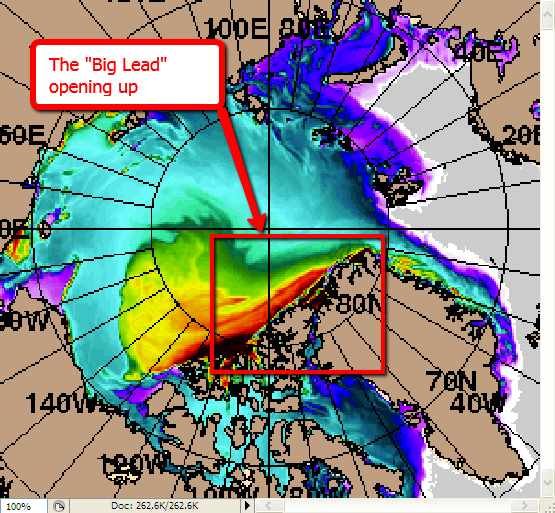
That will first of all give you some idea of the enormous area covered by the satellite images above. Then if you look closely you will see that the Navy's super-computers are predicting that the thickest ice in the Arctic, coloured from red to black in the animation, is going to separate from the north of Ellesmere Island and Greenland along the lines of these latest cracks.

US Navy Arctic sea ice thickness forecast for March 24th 2013

US Navy Arctic sea ice thickness forecast for March 24th 2013

Once that happens the multi-year ice will be at the mercy of the weather. If we're all lucky the winds may blow it straight back to shore. Alternatively it may be carried somewhere else entirely. Somewhere where it will ultimately be far more vulnerable to the sunlight already starting to beam down upon the Arctic Ocean once again, after the long Arctic night.

Following in Agatha's illustrious footsteps, I'll finish by quoting Alfred Lord Tennyson:

Out flew the web and floated wide
The mirror crack'd from side to side;
"The curse is come upon me," cried
The Lady of Shalott.

[Addendum March 22nd 2013]

Thanks to commenter Paul Beckwith for pointing out that the NOAA have now released their own video of the cracking progression shown in A-Team's video above, which continues up to March 18th. Here it is:

Filed under Disasters by

The Strange Tale of The Mail and The Snow Dragon

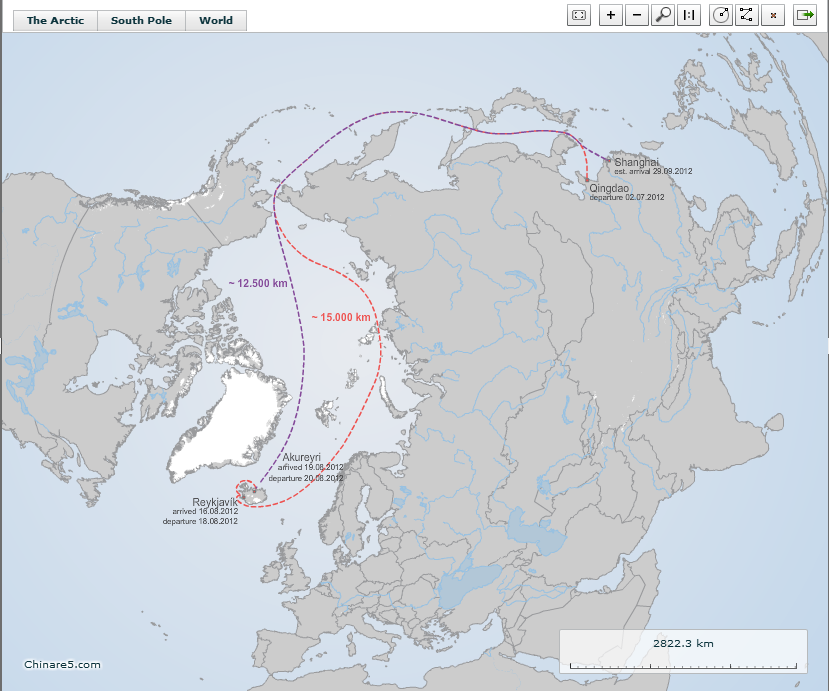
As I've recently been reporting over on the Arctic Sea Ice Forum, I inadvertently found myself having lunch with the Chinese delegation to the Economist's Arctic Summit in Norway last week. Amongst other things I learned about the voyage of the Chinese research vessel Xue Long (Snow Dragon in English) right across the Arctic Basin last summer:

The summer 2012 voyage of The Snow Dragon, courtesy of the Arctic Portal

The summer 2012 voyage of The Snow Dragon, courtesy of the Arctic Portal

Then over the weekend The Daily Mail published (again?!) an article by David Rose under the strident headline:

The Great Green Con no. 1: The hard proof that finally shows global warming forecasts that are costing you billions were WRONG all along!

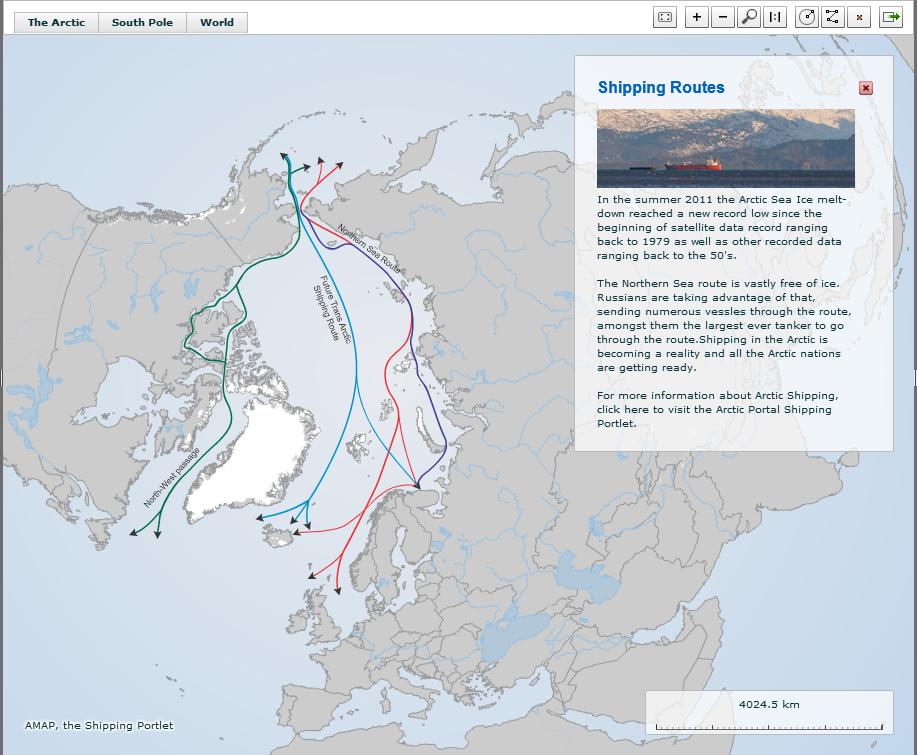
Needless to say the following article shows nothing of the sort. Fondly imagining that David and his loyal readership would be interested in learning about some of things I discovered on my recent trip to Oslo I posted a comment on David's article, which included this link to the following image (courtesy of The Arctic Portal once again):

Cross-Arctic Sea Routes. Past, present and future.

Cross-Arctic Sea Routes. Past, present and future.

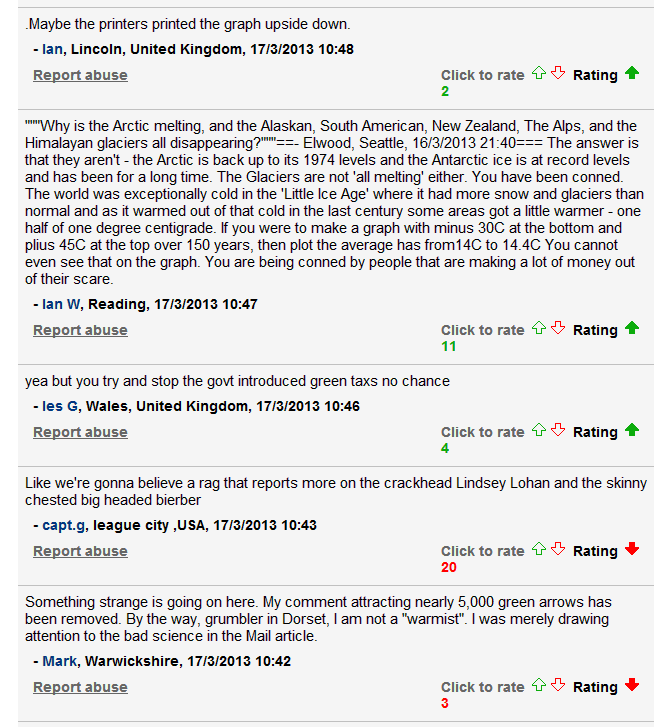
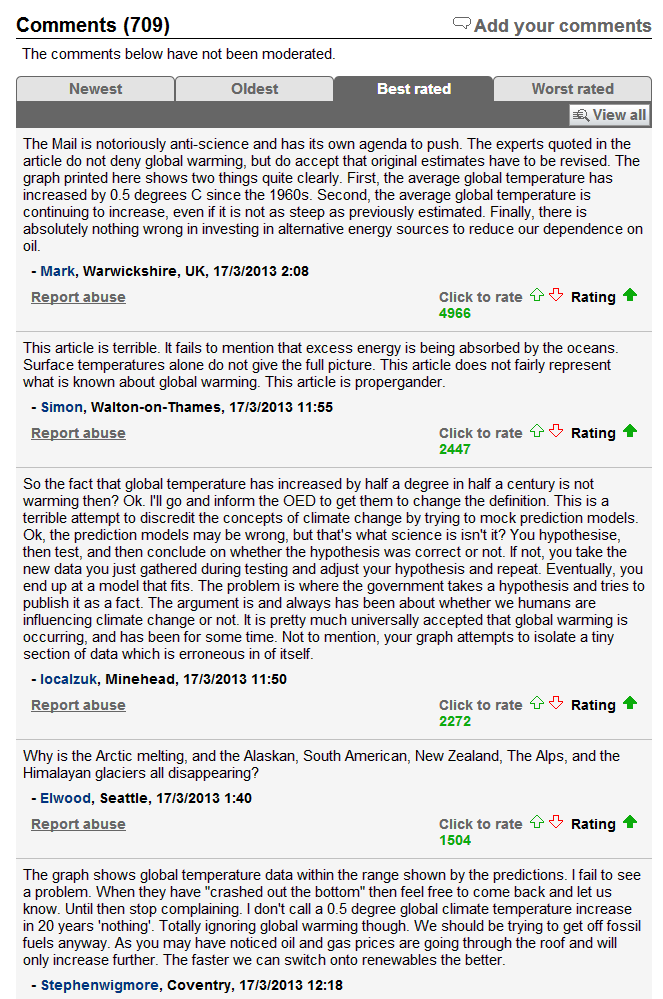
After a couple of hours I noticed that my learned comments seemed to have fallen foul of the Mail's moderator(s). So too had the most popular comment on the whole story from Mark in Warwickshire, who was complaining by then that:

Mark's message is missing!

Mark's message is missing!

My message was missing too, so I carefully read the Mail Online's "House Rules", which state (amongst other things) that:

We welcome your opinions. We want our readers to see and understand different points of view. Try to contribute to the thread, rather than just stating if you agree or disagree.

I figured that was exactly what I was endeavouring to do, so still somewhat baffled I read on:

You must not insert links to websites (URLs) or submit content which would be an infringement of copyright.

Figuring that I must have crossed on to the wrong side of this particular line I tried again, using the following carefully crafted form of words:

My previous comment seems to have fallen foul of the "house rules" so I'll try again. To discover what I was on about try Googling my username along with "Arctic Summit".

I attended the aforementioned event in Norway last week. If there was a Daily Mail reporter there they kept very quiet about it! Amongst the other matters under discussion the Russians and Chinese were obviously extremely keen on the idea of saving many billions (and hence making many billions!) of dollars by shipping many billions of tonnes of stuff across the Arctic Ocean in the very near future.

[link omitted to avoid offending the house rules]

Whatever the likes of Myles Allen and David Bellamy may have said in various locations at various times the message from the real world in Oslo last week is abundantly clear. Statements such as "No, the world ISN'T getting warmer" are extremely "economical with the truth".

That was over 24 hours ago, but still my wisdom from the East has failed to materialise at its intended destination. Perhaps someone from the Mail Online would be good enough to explain to me where I'm going wrong? Hopefully Mark is now a happy bunny at least, because today his missing message has been miraculously restored to the top spot amongst the currently 709 comments on the Mail's Message:

Mark's missing message is miraculously restored

Mark's missing message is miraculously restored!

Do you suppose one or both of my messages will benefit from a similar miracle in the near future, and who is "conning" who here?

Filed under Climate by