April 21, 2013
Has The Laptev Sea Ice Started Melting?
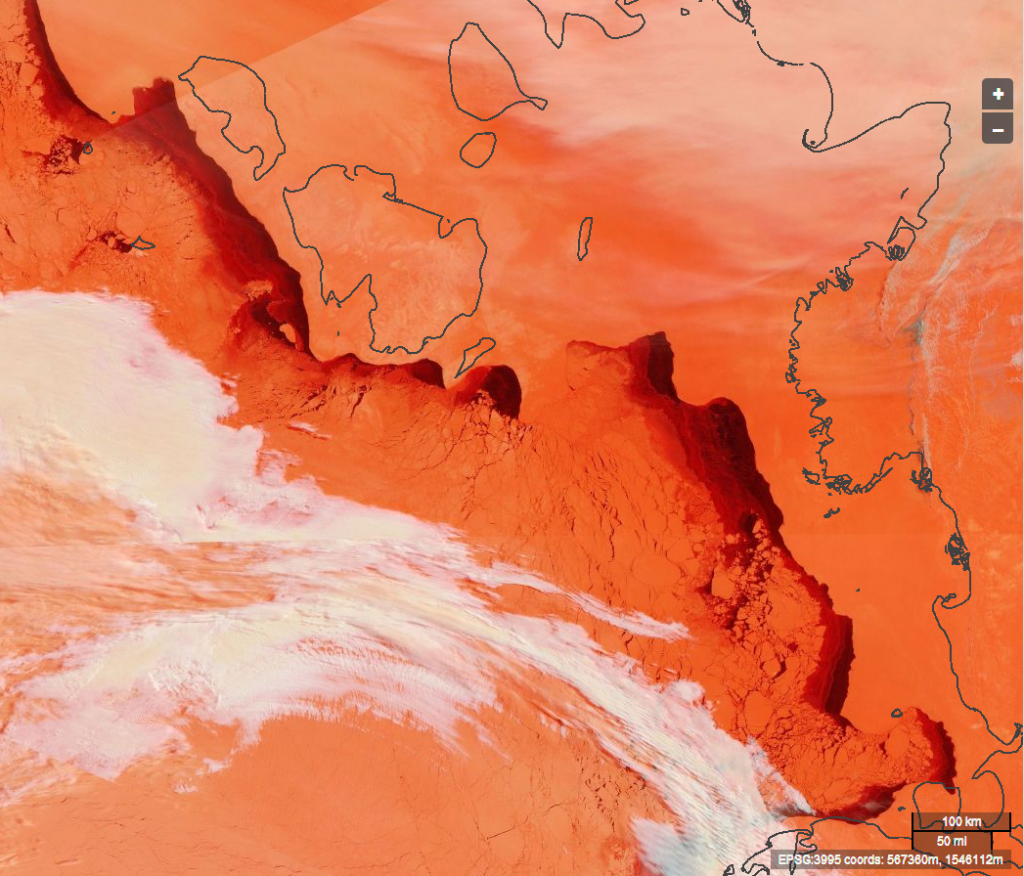
The set of cracks in the Arctic sea ice across the Beaufort and Chukchi Seas that we showed three days ago have now refrozen, and some new ones have opened up nearer the north coast of Alaska. However whilst that has been going on another set of "cracks" over on the Russian side of the Arctic have been growing ever wider. Here's how the Laptev Sea looks from space this morning:
You will note that this image looks a lot redder than the ones we showed you of the Beaufort Sea. That's because this one uses the Terra / MODIS bands 3-6-7 base layer instead of the true colour base layer used in those previous images. According to NASA's MODIS layer information:
The 3-6-7 composite assigns Bands 3, 6, and 7 to the red, green, and blue components of a digital image. This combination is good for revealing snow and ice because they are very reflective in the visible part of the spectrum, and very absorbent in Bands 6 and 7, which are a part of the spectrum called the short-wave infrared, or SWIR.
Since the only visible light used in these images (Band 3) is assigned to red, snow and ice appear bright red. The more ice, the stronger the absorption in the SWIR bands, and the more red the color. Thick ice and snow appear vivid red (or red-orange), while small ice crystals in high-level clouds will appear reddish-orange or peach.
Liquid water on the ground will be very dark since it absorbs in the red and the SWIR, but small liquid water drops in clouds scatter light equally in both the visible and the SWIR, and will therefore appear white. Sediments in water appear dark red.
It certainly looks as though there are some large expanses of open water in the area at the moment, and this is not a wholly unprecedented occurrence. In a recent academic paper entitled "Variability and trends in Laptev Sea ice outflow between 1992–2011" Krumpen et. al. point out that:
The pack ice drift is dominated by persistent offshore winds leading to a continuous export of ice out of the Laptev Sea. Between pack ice and fast ice edge, flaw polynyas are formed: the New Siberian polynya, the Western New Siberian polynya, the Anabar-Lena polynya, the Taymyr polynya and the Northeastern Taymyr polynya.
If you want to work out which one is which there's a diagram in the full paper. For a second opinion on whether there's currently open water in those polynyas let's now take a look at a different image, this time recorded by the Advanced Microwave Scanning Radiometer 2 (AMSR2 for short) aboard the Japanese SHIZUKU satellite:
If you look slightly left of centre you can see that there is a dark brown border along the edge of the Laptev Sea. It seems that both microwaves and short-wave infrared are agreed that there is open water in that area just at the moment. JAXA hadn't even launched the SHIZUKU satellite this time last year, but here's an image from a different satellite from exactly one year ago for comparison purposes:
Can you spot the difference in the areas of open water?
Filed under Climate by


Comments on Has The Laptev Sea Ice Started Melting? »
It looks like the areas of open water is the same.
What is the grey area on the last image? It should be ice covered in snow, am I right or wrong?
Hi Mintaka,
In the last image areas known to be land rather than sea (ice covered or not) are "masked out", i.e. converted to a uniform shade of grey to avoid confusing the viewer. That leaves open ocean coloured royal blue, and 100% sea-ice coloured white. Paler shades of blue indicate areas that are not completely covered in ice.
In the first image the coastline is (slightly inaccurately!) displayed as a black line.
In the middle image there is no land mask or coastline shown.
If you click on the second image you will end up on the JAXA web site, where you can check out different visualisations on different dates. Does that help at all?
Hm….at the first glance – it is more ice this year than last year :-).
If you're talking about the total "amount" of sea ice in the Arctic there's a variety of ways of measuring it. Here's JAXA's version of "extent":
http://www.ijis.iarc.uaf.edu/en/home/seaice_extent.htm
Below the graph there's a link to a table that shows 13,202,344 km2 for this year on April 20th, compared to 13,664,375 km2 last year, so I fear your eyes deceive you!
I'm actually referring to the open water in the midst of all that sea ice. Here's an expanded view of the Laptev Sea this year, to hopefully allow you to get your bearings:
Note that this image is rotated compared to the one at the start of the article.
Good work, thanks! Glad you met SkepticalScience – John Cook is Australian. Gareth Renowden's HotTopic (NZ) is good too.