October 3, 2013
Floods Return to South West England
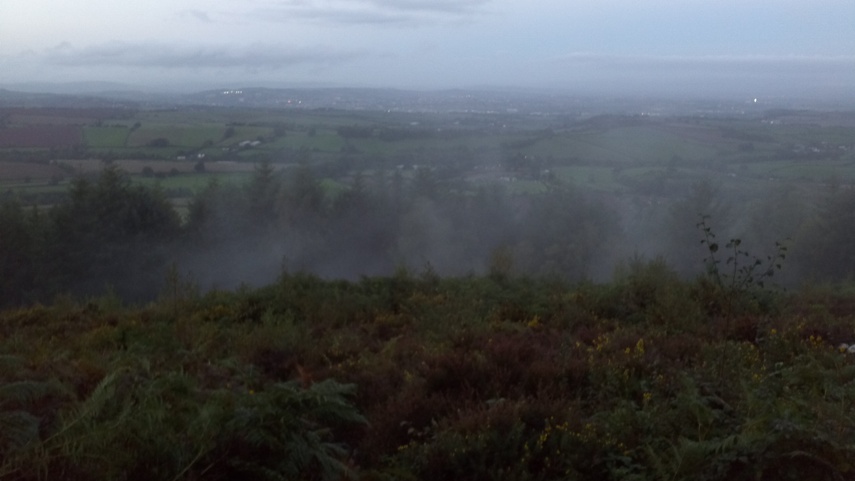
As recent summers go, we've had a cracker. All that's changing now though. I went for a bike ride earlier this evening, and things were reminiscent of this time last year. The roads were covered in soil and stones washed from the fields. The road along the ridge above here had but a narrow piece of tarmac visible above the brown ponds on either side. Here's a picture I took at the top of the hill:
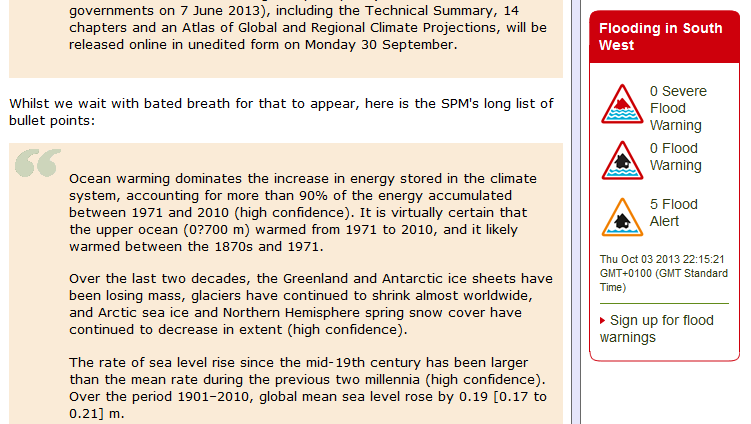
Summer has gone, and the season of mists and mellow fruitfulness is with us again. By the time I got home I was thirsty, so I turned on the tap. The water ran brown. I've just refreshed this very web site, and the handy flood warning widget revealed this to me, along with a few reminders from the Intergovernmental Panel on Climate Change about what's going on with our climate:
I clicked the widget, and sure enough I discovered that there have been five flood alerts issued across South Devon today:
As you can see, the warning triangles are currently amber, which according to the Environment Agency means:
Flooding is possible. Be prepared.
The Met Office headline for South West England this evening reads:
Further heavy showers tonight but gradually turning brighter tomorrow.
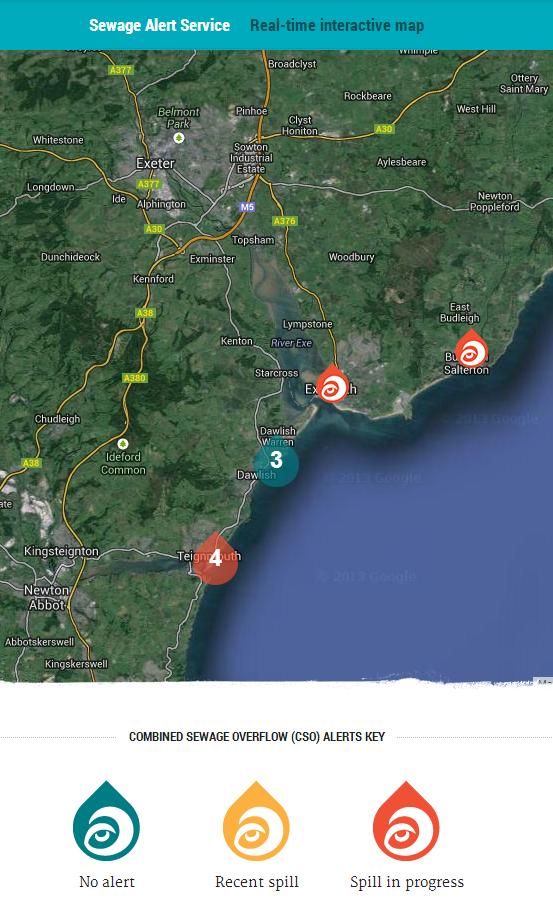
[Update on October 4th – Here's the current Surfers Against Sewage interactive map for South Devon]
Filed under Climate by


Comments on Floods Return to South West England »
Well, except what the IPCC said is that except for temperature, there is no trend in any other climate variable, including floods.
“There is limited evidence of changes in extremes associated with other climate variables since the mid-20th century”
“Current datasets indicate no significant observed trends in global tropical cyclone frequency over the past century … No robust trends in annual numbers of tropical storms, hurricanes and major hurricanes counts have been identified over the past 100 years in the North Atlantic basin”
“In summary, there continues to be a lack of evidence and thus low confidence regarding the sign of trend in the magnitude and/or frequency of floods on a global scale”
“In summary, there is low confidence in observed trends in small-scale severe weather phenomena such as hail and thunderstorms because of historical data inhomogeneities and inadequacies in monitoring systems”
“In summary, the current assessment concludes that there is not enough evidence at present to suggest more than low confidence in a global-scale observed trend in drought or dryness (lack of rainfall) since the middle of the 20th century due to lack of direct observations, geographical inconsistencies in the trends, and dependencies of inferred trends on the index choice. Based on updated studies, AR4 conclusions regarding global increasing trends in drought since the 1970s were probably overstated. However, it is likely that the frequency and intensity of drought has increased in the Mediterranean and West Africa and decreased in central North America and north-west Australia since 1950”
“In summary, confidence in large scale changes in the intensity of extreme extratropical cyclones since 1900 is low”
http://www.ipcc.ch/report/ar5/wg1/
I'm talking here on a local scale Les, not about a global average of extratropical cyclones. Here's the evidence from last year:
Here's some more from this year:
Getting on for an inch of rain on ground that is obviously already saturated.
IPCC AR5 WGI has this to say on the topic:
The shiny new Braunton flood defences were completed last summer. They were completely overwhelmed last winter.
The IPCC states that floods have not increased.
In summary, there continues to be a lack of evidence and thus low confidence regarding the sign of trend in the magnitude and/or frequency of floods on a global scale
If you build in a flood plain, it will flood. If you build on an erosion feature, like a delta or a beach, it will erode.
The literature is overwhelming on this: any increase in flood damage is due to an increase in exposure. More buildings, and more people, building in places we shouldn't.
At the risk of repeating myself Les, I'm not talking about global averages here, I'm talking about my little bit of North Atlantic facing Europe.
The engineers who designed the Braunton flood defences would seem to have been working to some outdated standards. Braunton town centre has been there for a long time, and a "once in a hundred year" event happened the very first winter.
I agree all sorts of stuff is being constructed in places where it shouldn't be. As the IPCC put it recently:
The local floods yesterday morning looked like this:
No, by including this statement, you implied that the flooding in the UK was due to global warming.
along with a few reminders from the Intergovernmental Panel on Climate Change
Les – I took a screenshot of the "Flood Warning Widget", and was intrigued by the juxtaposition with my prior musings on the IPCC meeting.
I've already quoted the IPCC's latest pronouncements on "heavy precipitation events". In this part of the world such events lead to localised flooding when the ground is already sodden. If you're interested in the current state of the associated science you may wish to read this article also.
Here's a video showing the side effects of such a "heavy precipitation event" a few years ago:
And the IPCC says that there is no trend in flooding, globally.
Trying to tie local flooding to global warming is going against the science.
And again, the science says that its increased exposure, not increased flooding, that is the problem.
As I recall, floods were also common in the 50s and 60s in the UK. Subsequent reductions in floods, was followed by reduced restrictions on building in flood areas.
Those chickens are now coming home to roost.
Yes, floods started to reduce in the 60s, and exposure increased, due to complacency on the reduced floods.
https://www.dur.ac.uk/news/newsitem/?itemno=6468
Les – Your link seems to make my point for me? My link directed you to the latest relevant science. Here is a brief history of Braunton, and of Boscastle.
You will no doubt note that both have been around for a lot longer than the United States of America.
No, my link showed that UK floods come in cycles.
Relaxed regulations made during the down cycle are now shown to be inadequate as the cycle turns up.
And the latest IPCC science states unequivocally, that there is no apparent trend in floods.
So we're agreed that floods in South West England are currently increasing in magnitude and/or frequency Les, even though the IPCC insists they're not?
As you can see, I'm still not following your argument! Are you endeavouring to make the point that the increased flooding which we seem to agree is in fact taking place in this neck of the woods is not "caused by anthropogenic global warming" but is merely part of some "natural cycle" or something along those lines?
Yes, as my last reference points out. Its part of a cycle. Its now turning to the wetter portion of that cycle. Combined with more building on flood plains, it will result in more flood damage. Odd that flood plains actually flood, no?
The IPCC says that globally, there is no trend in floods. That means if its incraesing in the UK, its likely decreasing somewhere else.
According to The Guardian today:
Flooding in the UK follows cycles. That cycle is now turning to the wetter phase.
Homes built on flood plains will probably flood.
Globally, according to the IPCC, there is no trend in floods. Nor does the IPCC warn of it increasing in the next century.
Looking at the UK precipitation records, I don't see any increase in extreme events (daily) or in total precipitation (monthly and seasonal).
http://www.metoffice.gov.uk/hadobs/hadukp/data/download.html
If you plot the monthly data, you can see a cycle in the record, especially if you use a 10 to 30 year moving average. The cycle appears to be in an unptick, but still well below historical highs.
Precipitation is increasing over the reord, but only at an 0.17 mm/year. One SD is 120 mm, so this is insignificant.
corigendum:
I don't see any increase…
should be:
I don't see any significant increase…
Les – I'm currently on my travels so firing up a spreadsheet isn't really realistic at the moment. A couple of things to note though.
It's perfectly feasible for East Anglia to be suffering from drought whilst South West England is under water.
South West England is lumped in with Wales, but even so it doesn't come as a surprise to discover that for this area 2012 is the wettest year on record according to the Met Office.
So, the weather in one year is climate? I thought climate was a 30 year trend.
But yes, in SWE and Wales, 2012 was the record year. A whopping 3 mm more than 1960. Note that the trend in SWE and Wales is also an insignificant 0.15 mm/year increase. In other words there is no trend.
Lets look at record years…the UK has about 0.165% of the global land area. That would mean, on average, every year, there will be 6 equivalent areas of the UK that has a 100 year precipitation event.
Hi Les,
I'm now back in South West England, and weather in one year does not make a climate! When I have a spare moment I'll endeavour to run up a spreadsheet and see if I can duplicate your figures. What's your definition of "the trend" in this instance?
The trend is over the entire recorded period.
Excluding 2013, of course, as the data is not complete. Excluding 2013 gives that trend, which is slightly higher than the trend than when including the year 2013.
and to be specific, the trend is 3 mm/year.
Are you doing a simple linear regression on the entire series (excluding 2013)? If I do that I end up with a slope a lot less than 3 mm/year!
From your earlier comments I was assuming you'd be doing a 30 year moving average or something similar.
Hi Les,
There's now been some more floods over here, and James Screen from the University of Exeter has also just published a new academic paper on the subject. He suggests that a 5-year mean is a relevant metric: